Here is an hourly chart of the December S&P e-mini futures. I last commented on this market this morning.
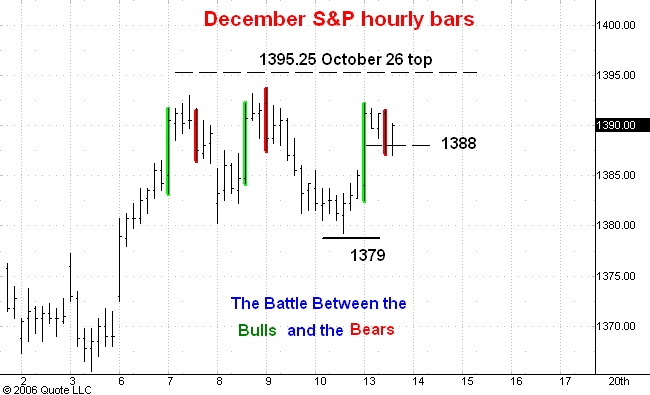
So far the market has been supported near the 1388 level. On this chart I have illustrated the battle between the bulls and the bears that has been fought during the past week.
The three wide range bars highlighted in red show the bears' aggressive selling. Note how they begin and end at just about the same price in each case. This tells me that the same people have been involved in each of these three selling episodes.
The three wide range bars highlighted in green show the bulls' aggressive buying. Again note how they begin and end at roughly the same price in each case. This means that the same people have been involved in each of these three selling episodes.
But note that the market is now in its fourth hour after this morning's high. At each of the two previous tops on the chart the market had broken substantially by this time. But today it is holding 1388 support. This makes me think that the bears have run out of ammunition and that the market is about to break out above the 1395.75 level.
2 comments:
Quote: The three wide range bars highlighted in green show the bulls' aggressive buying. Again note how they begin and end at roughly the same price in each case. This means that the same people have been involved in each of these three selling episodes.
I wonder if since the wide range bars are turning on pivot points, if that isn't market makers trying to get the flock to carry it up but each time the flock consolidates in lack of confidence on these double tops.
1385+/- cash SPX is the 1.618/.786 fib extension alot are watching (May high)-(June low) x 1.618 + (June low). Alot of sellers should be here as expected, but good rally above this level definitely not impossible.
Chart here....
http://66.185.224.56/FreeTools/Futures/MonthlyUpdated/SPXMon.GIF
Post a Comment