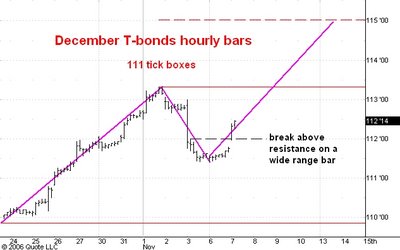
Here is an hourly chart of December T-bond futures. I last commented on this market here.
I had been thinking that the drop from 113-10 would be a three stage affair with the second rally phase stopping near 112-04. But this morning you can see that the intial hour of trading put in a wide range with a high close well above this resistance, in fact even further above the 112-00 level which was the high of the first rally after Friday's break on the employment number. This is a bullish indication.
There is a second bullish indication arising from my "dog that didn't bark" theory. Friday's big break should have been followed visibly lower prices yesterday or today if it was the kickoff for a bigger drop. But yesterday was quiet near the lows with a late rally. Today the bonds gapped higher and kept on going. So the lack of bearish follow through to Friday's aggressive selling is in itself a bullish indication.
So I now believe that the bonds have started a move to the 1/2 point of the next higher box which I have drawn on the chart. This is the 115-01 level. Support today is at 112-00, the low of the opening, wide range bar breakout.
No comments:
Post a Comment