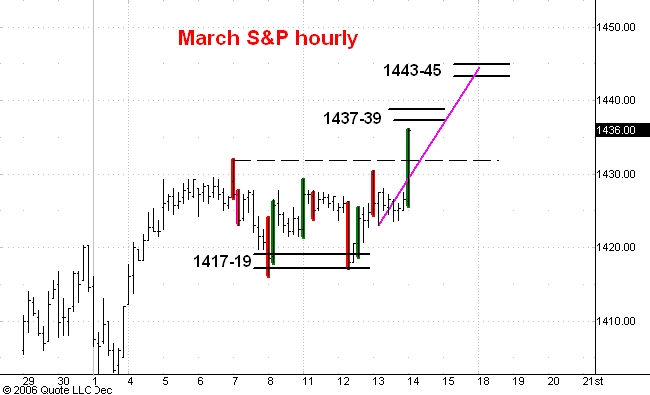
Here is an hourly chart of the March S&P futures. I last commented on this market here.
The market is breaking out of its recent trading range on high volume. The trading so far during the opening hour is shown in the last bar highlighted in green.
I think the sideways action in the trading range was subtantial enough and the buying so far aggressive enough to make the 1443-45 range a more plausible resistance zone than 1437-39. Meantime support is at 1431.
Those of you who track the cash S&P should subtract 12 points from these numbers to convert from the March futures to cash.
2 comments:
Carl, if you get some time, could you opine on what you see as the future of pattern trading given the dramatic rise in computer driven trading (both to-date and predicted)? Have you noticed any effects of computer trading/artificial intelligence on your system over your trading experience? Ray Kurtzweil's new hedge fund, FatKat, made me think of this...
Carl, you were dead on the S&P Futures call. Nice job, I'm going to start reading your blog more often, as I am just starting to trade Futures over day-trading stocks. Come check me out as well.
Post a Comment