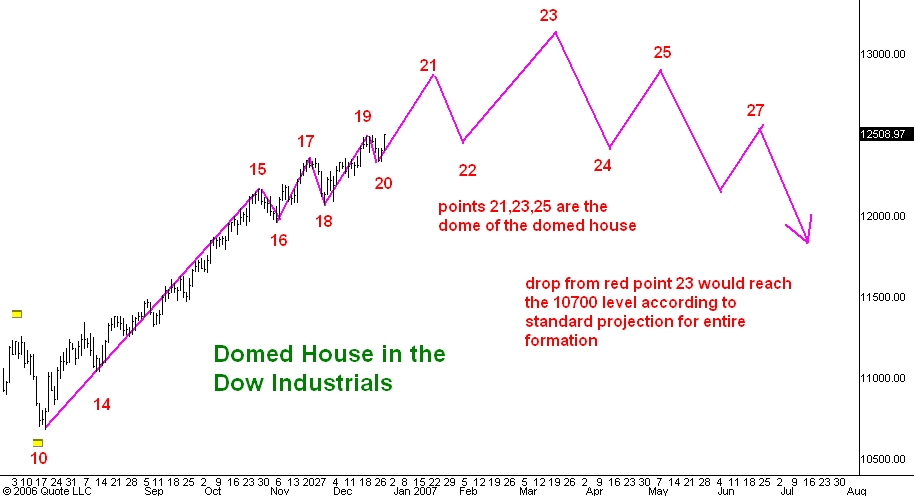
Here is a daily chart of the Dow Industrial average. I have numbered the turning points of this example of George Lindsay's Domed House formation in red. I last commented on this chart here.
I think there is a good chance that the market put in its point 20 low late last week. I am now looking for the dome of the Domed House to form. This will consist of points 21-25 and should assume the shape of a classic "head and shoulders" top. I have revised my estimate of the timing and price level for point 23, the peak of the domed house. Now I think it will occur in late March 2007 in the Dow 13000-13200 range.
4 comments:
I am believe that not,i am to see 4-20 march the dow jones more down,maybe 10.800.Buy in 12500 or more i am believe is very dangerous.The market is a play of cycles very rare.12600 the dow jones not more.
Regards.
yes -- to learn how to express himself is nearly as important as how to trade or at least try to .
hi
im curious with the dow chart
can your points 15 16 17 18 19
on the latest 3 peaks domed house be also where we would start a lindsay count from the mid section ???
if so would this be point G we are
running into now ????
point H mid january
point j late jan early feb ???
you and i dont agree on where the top is . yet we do agree on many other things . the lindsay time spans and mid section counts are new to me .
food for thought is all
I am now looking at the nasdaq chart and it is now looking like point 23 is forming. What are your thoughts that we are hitting point 23 in the nasdaq?
Post a Comment