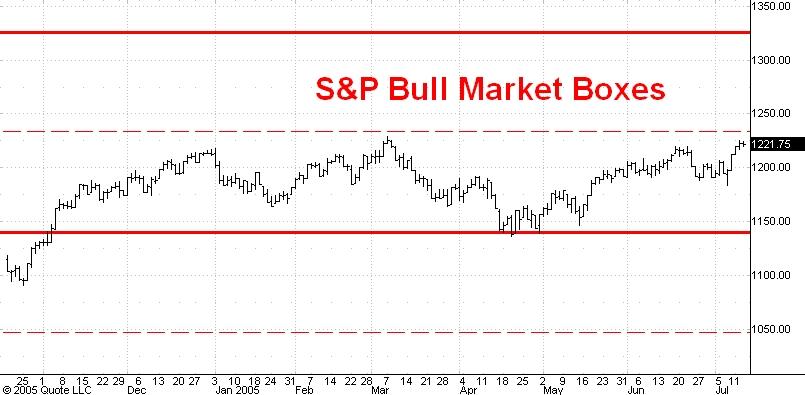
The daily chart you see above shows the bull market boxes in the cash S&P index. These boxes are 186 points high and start at the 768 cash low of October 2002. You can see that the market has been bouncing between the bottom and the 1/2 point of its third box for the past 8 months.
During that time the media have told people to worry about a collapsing dollar, a bubble in real estate, a slowing economy, rising interest rates and a stupid/ malicious president. Yet the market has only gone sideways. That dog didn't bark!
I think a move to the top of the current box near 1320 is imminent.
No comments:
Post a Comment