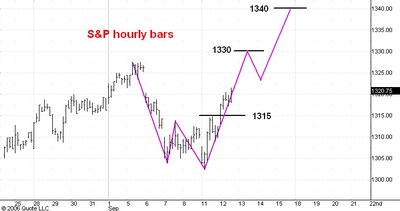
Here is an hourly chart of the December S&P e-mini futures.
In the post I made about 90 minutes ago I explained why I had changed my mind about the short term trend direction and believed it was now upward. On this hourly bar chart I have drawn the resistance and support levels which I believe will control the market's action over the next couple of weeks.
First of all, I expect a minor hesitation of a day or two once the market reaches the 1330 level, just above its September 5 top and just below the May 5 top. Support for any reaction from that level will be a 1315.
The next drop of any significance will probably develop from about the 1340 level, although even then I doubt we shall see more than a 25 point break.
I still believe that we shall see the S&P trade above 1400 by the end of the year.
No comments:
Post a Comment