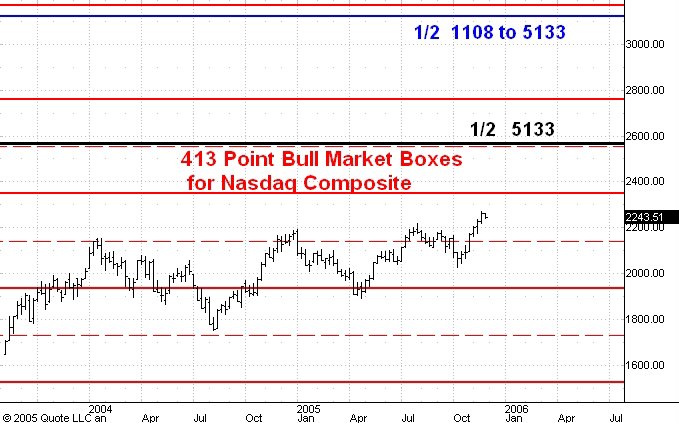
Here is a weekly chart of the Nasdaq Composite Index.
I have drawn the bull market boxes in red and two price targets for the bull market. The black line is drawn at 2567 which is 1/2 the all time high of 5133. I think this is the minimum target for the upmove from the 2002 low at 1108.
The blue line stands at 3120, the 1/2 division point of the range for the 2000 - 2002 bear market. I still think the market has at least a 50-50 chance of reaching this higher level before a break of as much as 30% occurs.
1 comment:
where do you think AAPL and YHOO are headed for this bull market? would appreciate your analysis.
Post a Comment