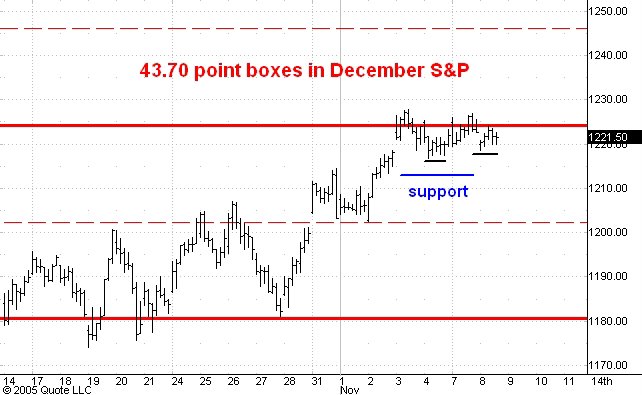
Here is an updated hourly chart of the December S&P futures.
As you can see the market has been trading sideways for a couple of days just below the top of the current box at 1224. After the run up from the October 28 low near 1180 a reaction to the blue line near 1213 would have been normal. Instead we see a market that today made a higher low (black lines) after a subnormal reaction that ended around 1217.
I think this is a sign of strength and it is telling me that the market will probably hit 1246 before a more substantial reaction develops. Even if I am wrong about this I still believe that the blue line will support any reaction from current levels.
No comments:
Post a Comment