In this October 7 post I discussed my interpretation of the Lindsay's basic advances and declines in the Dow industrials over the past 7 years. I just took another look at the associated chart and realized that the most important part of the post, the forecast part, talked about basic advances and declines that were not shown on that chart.
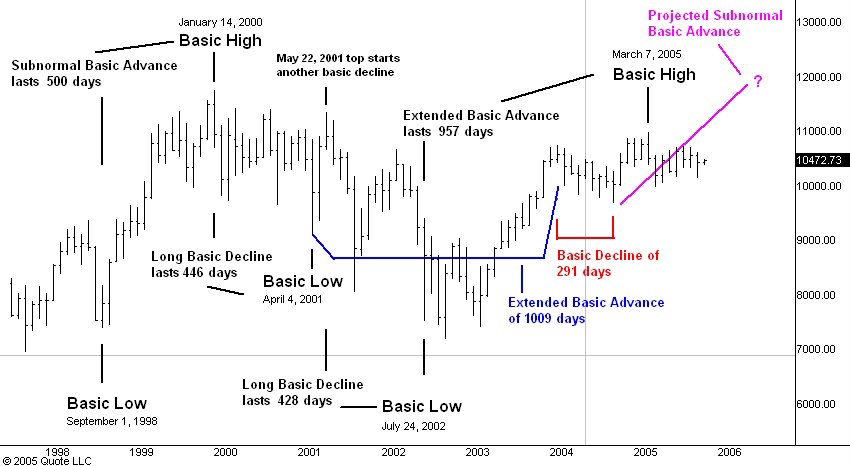
So here is an enhanced version of the same chart. The extended basic advance from April 2, 2001 to January 8 2002 is shown in blue, the subsequent basic decline in red and the projected subnormal basic advance in purple.
I might add that the basic advance which is shown ending in March 2005 was an extended basic advance and for that reason is likely to develop what Lindsay called a "right shoulder". This is another upleg in the bull market that often exceeds the top of the basic advance and ends six to twelve months later. Such a right shoulder top would be consistent with my current interpretation of Lindsay's three peaks and a domed house formation as well as with the 15 year three month time period from low to high and the projected subnormal basic advance from the October 2004 low.
No comments:
Post a Comment