Here is a chart of the Rydex Cash Flow Ratio, courtesty of Decisionpoint.com . Only subscribers can access this chart but there is lots of other good stuff on Decisionpoint's site that makes the $20 monthly subscription well worth it.
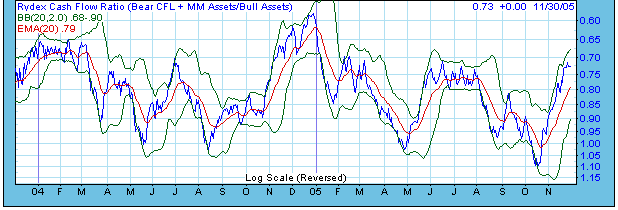
I last commented on this indicator here. The basic idea is simple enough. The blue line shows the daily value of the ratio. High values of the ratio (which show up as low values on the chart because of its inverted scale) mean that traders are bearish about stock market prospects. Low values (which show up high on the chart) mean that they are bullish. As a rule one wants to "fade" widely held opinions, which means buying when the ratio is high (i.e at low levels on the chart) and selling when the ratio is low (i.e at high levels on the chart).
As you can see the cash flow ratio has been steadily dropping from its record high levels seen at the October low as one would expect in the face of a strong market rally. The daily values have dropped to the levels we last saw at the July top. I expect to see daily values near their December '04 low levels and to see the 20 day exponential average (red line) at similar low values before this move up ends.
No comments:
Post a Comment