Nowadays I don't use oscillators to evaluate the market's condition. But when I first started doing technical analysis 40 years ago I put a great deal of emphasis on the 10 day moving average of the number of advancing issues on the New York Stock Exchange. Over the years it has proven its value and it is the only oscillator I look at. I should say too that I find the daily numbers themselves even more valuable.
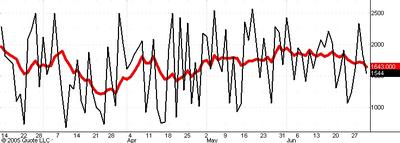
The chart above shows the daily count (in black) of the number of advancing issues on the NYSE and the 10 day moving average of these numbers (in red).
You can see that while today the S&P dropped quite close to Monday's low there were about 500 more advancing issues than there were on Monday. This together with the fact that Tuesday's number was the highest in almost a month and higher than several of the preceeding daily peaks is evidence that Monday's low will hold.
The 10 day moving average is well above its April lows, again suggesting that the drop from 1225 is only corrective. Note how this moving average was significantly higher at the April 18 low than it was in late March on the way down to that low. Such divergences at lows in a bull market are usually very significant.
No comments:
Post a Comment