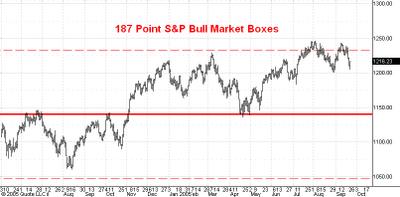
Here is a daily chart of the cash S&P 500. I've drawn the 187 point boxes that have so far controlled the bull market advance from the 768 low in October 2002.
As you can see the market has bounced off the 1/2 point of the current box three times in the past six months, a very unusual event. Nonetheless, I expect the market to rally at least to the top of the current box near 1325 by the end of the year.
1 comment:
Your Box Lines appear incorrect in this latest SPX chart ...where is the box line at 1268?(Your next upper target...what about 1183? shouldnt there be 1 there too..the 1143 area 1 appears correct on your chart though ..have you changed box sizes?
Post a Comment