December S&P Futures: The market has reached the 1350 level. Support today is again at 1340. I think a 20-30 point reaction will begin from 1360 or so. Much higher prices are likely later this year.
December Bonds: Resistance is at 113-12 and the market is likely to drop to 112-00 before resuming its rally. I also think that the market will rally into the 114-115 range before a more substantial drop develops.
December 10 Year Notes: The market has reached resistance near 108-16 but should hold support around 108-00. I think the notes will rally into the 109-110 range before a more substantial drop begins.
Euro-US Dollar: I think that support at 126.80 has broken and that the market is headed back down to 124.50 and eventually much lower than that.
Dollar-Yen: The yen is now headed for resistance at 119.50.
November Crude: Resistance is at 64.00. I think the market will probably take a peek below 59.00 before an even bigger rally begins. I expect to see crude trading in the 50-55 range sometime during the next 6 months.
December Gold: I think a move below the 500 level is underway. Today resistance is again at 607.
December Silver: Resistance is at 1195. I think the market will soon resume its drop to below 900.
Google: Support is at 394 and I think GOOG will soon move above its all time high of 475.
Friday, September 29, 2006
Thursday, September 28, 2006
S&P
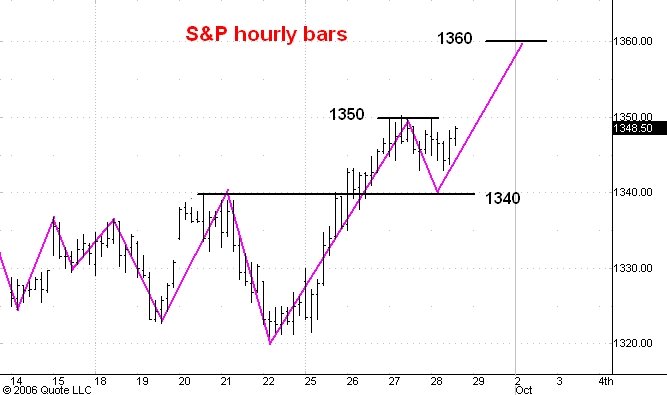
Here is an hourly chart of the December S&P e-mini futures. I last commented on this market yesterday.
So far the market has held well above the 1340 level and now I think it is about to breakout of the past two day's trading range on the upside. We should see a quick move to 1360 from which point I think a 20-30 point break will begin.
Euro-USD and USD-Yen
The yen is now trading around 117.90 and I am going to abandon my 114.30 downside target. I now think the yen is headed for 119.50.
The Euro-USD is trading at 126.94 and is still holding 126.80 support. I just can't even make an educated guess whether this support will hold or not. If it fails I shall abandon the 131.50 upside target.
The Euro-USD is trading at 126.94 and is still holding 126.80 support. I just can't even make an educated guess whether this support will hold or not. If it fails I shall abandon the 131.50 upside target.
Guesstimates on September 28, 8:50 am ET
December S&P Futures: The market has reached the 1350 level. Support today is again at 1340. I think a 20-30 point reaction will begin from 1360 or so. Much higher prices are likely later this year.
December Bonds: Resistance is at 113-12 and the market is likely to drop to 112-00 before resuming its rally. I also think that the market will rally into the 114-115 range before a more substantial drop develops.
December 10 Year Notes: The market has reached resistance near 108-16 but should hold support around 108-00. I think the notes will rally into the 109-110 range before a more substantial drop begins.
Euro-US Dollar: The market has so far held support at 126.80 and as long as it does I shall stick with my 131.50 upside target.
Dollar-Yen: Since the euro-dollar is holding support I have decided to give the yen a little more room on the upside. So long as the yen holds resistance at 117.60 I shall stick with my downside target of 114.30.
November Crude: Resistance is at 64.00. I think the market will probably take a peek below 59.00 before an even bigger rally begins. I expect to see crude trading in the 50-55 range sometime during the next 6 months.
December Gold: I think a move below the 500 level is underway. Today resistance is again at 607.
December Silver: Resistance is at 1195. I think the market will soon resume its drop to below 900.
Google: Support is at 394 and I think GOOG will soon move above its all time high of 475.
Wednesday, September 27, 2006
E-Bay
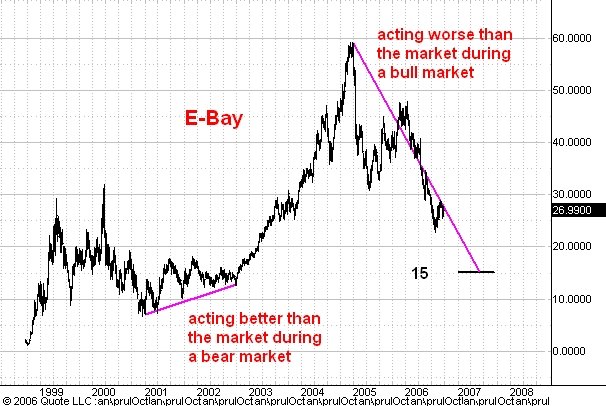
Here is a highly condensed weekly bar chart of E-bay. This is the first time I have commented on this stock and the reason is easily seen from its chart.
During a bull market one wants to own stocks that are keeping pace with or even outperforming the averages. But E-bay made its bull market high in January of 2005 when the S&P was trading around 1215. It has dropped substantially since then while the S&P has rallied to 1340. I think this underperformance will continue for a while and will drop E-bay to 15 or so.
Notice how the current situation contrasts with that of the 2001-2002 period. During those two years E-bay managed to rally in the face of a big bear market drop in the averages. This overperformance predicted the big bull run in E-bay which carried it from 15 to 58 during the next two years.
S&P
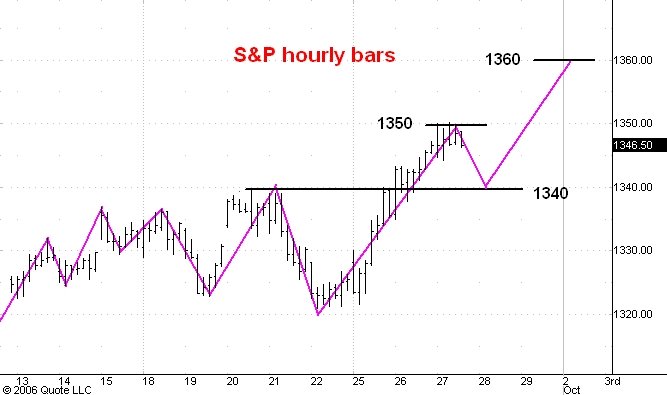
Here is an hourly chart of the December S&P e-mini futures. I last commented on this market here.
As you can see the market has been stalling today at 1350 resistance. Since we have seen two consecutive days of uncorrected advances I think it is likely that a brief reaction to support at 1340 will develop. After that the next step upward should carry to 1360.
Chicago Merchantile Exchange
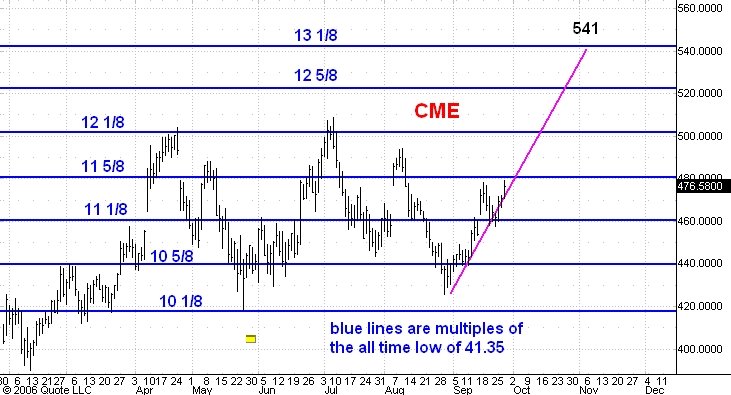
Here is a daily bar chart of the Chicago Merchantile Exchange. I last commented on CME here.
I am still bullish on CME and expect to see it trading at the 541 target by then end of the year.
Sears Holdings

Here is a highly condensed daily bar chart of Sears Holdings. I last commented on SHLD here.
The uptrend you see on the chart from the 111 low remains intact. I think SHLD will reach my 181 target by the end of the year.
Satchel Paige on Market Forecasting
Satchel Paige is an American baseball legend.
My reposting of "Predicting the Past" brought to mind Paige's advice which I think should be taken seriously by all speculators: "Don't look back! They might be gaining on you!"
My reposting of "Predicting the Past" brought to mind Paige's advice which I think should be taken seriously by all speculators: "Don't look back! They might be gaining on you!"
My Forecasting Record
Those of you who are new readers of this blog should take a look at the links listed in the right hand column. These link to chronologically ordered archives of all my posts, listed by topic.
Guesstimates on September 27, 8:50 am ET
December S&P Futures: The market has nearly reached the 1350 level. Support today is at 1340. I think some sort of reaction will develop from a high within the 1350-60 zone but I also think any such reaction will end near 1330, the level of the May high. Much higher prices are likely later this year.
December Bonds: Resistance now is at 113-12 and the market is likely to drop to 112-00 before resuming its rally. I also think that the market will rally into the 114-115 range before a more substantial drop develops.
December 10 Year Notes: The market has reached resistance near 108-16 but should hold support around 108-00. I think the notes will rally into the 109-110 range before a more substantial drop begins.
Euro-US Dollar: The market has so far held support at 126.80 and as long as it does I shall stick with my 131.50 upside target.
Dollar-Yen: Since the euro-dollar is holding support I have decided to give the yen a little more room on the upside. So long as the yen holds resistance at 117.60 I shall stick with my downside target of 114.30.
November Crude: The market is getting close to the 58.80 downside target. The next significant development should be a rally of 5 to 10 dollars. Ultimately the current drop will carry the market down into the 50-55 range.
December Gold: I think a move below the 500 level is underway. Today resistance is again at 602.
December Silver: Early this morning the market moved above resistance at 1150 so I think it will continue upward to 1195. After that I think the market will resume its drop to below 900.
Google: Support is at 394 and I think GOOG will soon move above its all time high of 475.
Tuesday, September 26, 2006
Google and Fibonacci
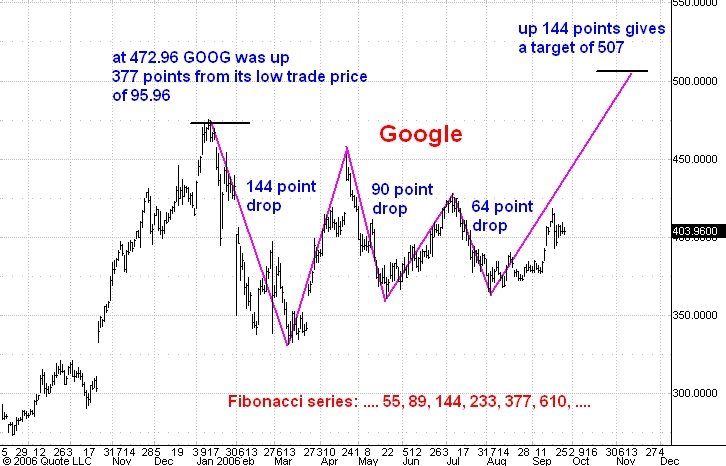
Here is a daily chart of Google. I last commented on GOOG here.
In that last post I observed that the big swings in GOOG were very close to The numbers in the Fibonacci series. Continuing on this theme I am willing to guess that the swing up from the recent low at 363 will amount to 144 points and carry GOOG to the 507 level.
S&P

Here is an hourly chart of the December S&P e-mini futures. I last commented on this market here.
As you can see the futures have rallied to new highs for the bull market which started from the 768 low in October 2002. The next significant reaction will probably develop after the market reaches the 1350 level. Meantime the last visible reaction occurred early yesterday and was 8.50 points in length. A reaction of similar size from the current high today of 1343.25 would drop the market to eh 1335 level. So I conclude that 1335 will be support until the futures reach 1350.
Guesstimates on September 26, 8:50 am ET
December S&P Futures: The market is headed for the 1350 level. Support is now at 1330. Much higher prices are likely later this year.
December Bonds: Resistance now is at 113-12 and the market is likely to drop to 112-00 before resuming its rally. I also think that the market will rally into the 114-115 range before a more substantial drop develops.
December 10 Year Notes: The market has reached resistance near 108-16 but should hold support around 108-00. I think the notes will rally into the 109-110 range before a more substantial drop begins.
Euro-US Dollar: The market has sagged back below the breakout level of 127.60. I expect it to hold support at 126.80 but if it doesn’t I shall have to abandon my current 131,50 upside target.
Dollar-Yen: The yen is trading a little on either side of 116.40 support which I thought was broke to the downside yesterday. A move above 117.00 will force be to abandon my 114.30 downside target.
November Crude: The market is getting close to the 58.80 downside target. The next significant development should be a rally of 5 to 10 dollars. Ultimately the current drop will carry the market down into the 50-55 range.
December Gold: I think a move below the 500 level is underway. Today resistance is again at 602.
December Silver: I think the market is on its way below 900. Today resistance is at 1150.
Google: Support is at 394 and I think GOOG will soon move above its all time high of 475.
Monday, September 25, 2006
Debt Headed Up!

Here is an image of the current cover of The Economist magazine. And here is a link to today's headline story in the Wall Street Journal : "U.S. Foreign Debt Shows Its Teeth As Rates Climb" (subscription may be required!). I commented on a similar cover story in the New York Times this past June.
As you know my theory of the main stream media (MSM) is that they are in the business of telling their readers what their readers want to hear. Over and above that, the MSM are generally of an elitist bent and ardent followers of the latest fashion and fad, especially in political and economic thought. Both of these factors make them particularly good contrary opinion indicators.
Both The Economist and the Wall Street Journal are again flogging the USA debt story. For the past thirty years the MSM has been telling us that bankruptcy has been descending on the USA. Yet somehow it always seems to land somewhere else (like Mexico, South Korea, Thailand, and Russia)!!
These stories are designed to scare you out of fixed income investments. But I think they are telling us that a new bull market in bonds is underway. The price of debt is headed up!
Three Peaks and a Domed House Update
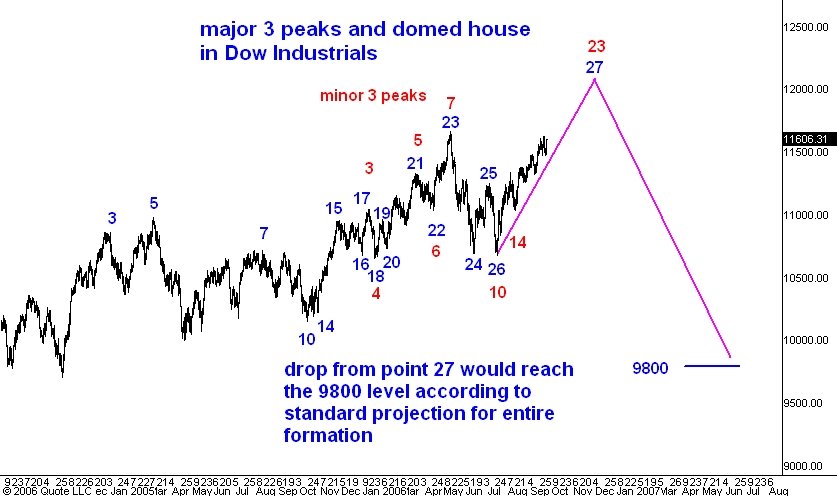
Here is a highly condensed daily bar chart of the Dow Industrial average. On it I have marked the turning points of a pair of George Lindsay's three peaks and a domed house formations which I have been following. Here is my last post on the subject. You can read my posts on this ongoing formation by following this link to all of my George Lindsay posts.
For the past several months I have been saying that we are well along in the major formation which is labeled by the blue numbers at its turning points. Right now I think we are in a rally to point 27. Normally point 27 will not exceed point 23 but in the current situation there is a complicating consideration.
There is also an easily identified minor three peaks which I have labeled in red. This minor formation has not yet established point 23, the top of the domed house. Point 23 is generally the highest point of the formation and this is what led me to think that blue point 27 (which will coincide with red point 23) will be above blue point 23.
For reasons I have discussed previously I think that blue point 27 and red point 23 will probably develop in late November of this year a bit above the 12000 level in the Dow. Upon completion of point 27 Lindsay's theory says that the market should fall to the start of the entire major (blue) formation. This in my estimation is the 9800 level in the Dow.
S&P Update
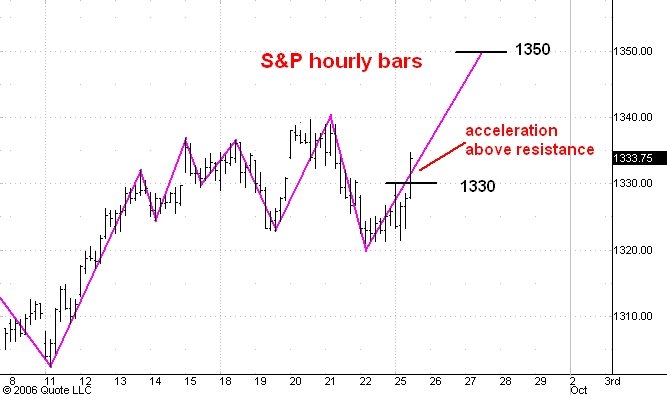
Here is an hourly chart of the December S&P e-mini futures. I discussed this market earlier today.
The S&P's have accelerated above resistance at the 1330 level. This tells me that the correction from 1340 is already complete and that 1315 will not be reached. I expect the S&P's to soon be trading at 1350.
T-bonds
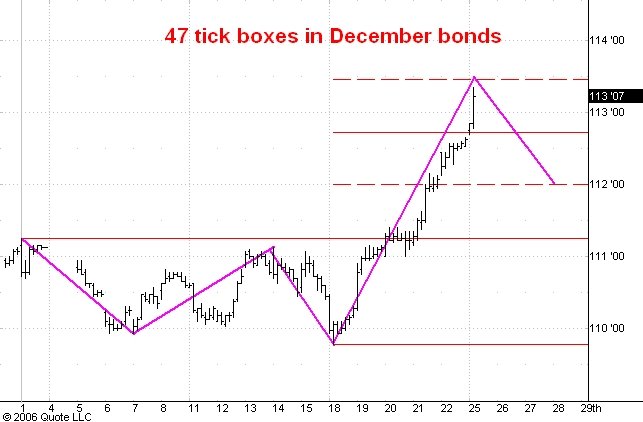
Here is an hourly bar chart of the December T-bond futures. I last commented on this market here.
I thought that the market would halt its advance temporarily near the top of the last box at 112-23. Instead today we have seen a burst of strength which so far has carried the bonds up to near the midpoint of the current box near 113-14.
A short while ago the market advanced about 12 ticks in just 5 minutes. This action comes after an extended and uncorrected rally from the 113-25 level. In such circumstances a sharp advance which brings the market near resistance (the midpoint of the current box) is likely to indicate the temporary end of the current trend. I think this is what is happening and I expect the market to drop to the midpoint of the last box near 112-00 before another significant advance starts.
It is important to remember that we are in the first stage of an extended bull market in bonds which began from the low at 105-11 in May. I think this first stage will now carry into the 114-115 range. From that range a reaction lasting several weeks will probably develop.
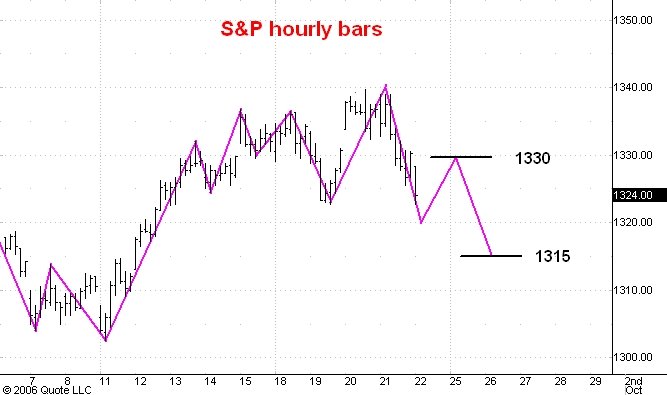
S&P

Here is an hourly chart of the December S&P e-mini futures. I last commented on this market Friday.
The market has bounced off of 1330 resistance and has now begun the third phase of what I think will be a three phase drop to 1315 or so. I suspect that the S&P's will take one more peek above the 1330 level before the drop to 1315 begins in earnest. In any case once this three phase correction is complete I expect the market to rally into the 1345-50 zone.
Guesstimates on September 25, 8:50 am ET
December S&P Futures: The market has rallied to 1330 in electronic trading this morning and I think the next development will be a drop to 1315. After that a rally to 1345 will be likely. Much high prices are likely later this year.
December Bonds: The bonds are trading a little above the top of the current box at 112-23. I think the next development will be a break of one to two points. I also think that the market will rally into the 114-115 range before a more substantial drop develops.
December 10 Year Notes: The market has reached resistance near 108-16 and should break no more than a point from here. I think the notes will rally into the 109-110 range before a more substantial drop begins.
Euro-US Dollar: The market has decisively broken above resistance at 127.60. I think this means that the trend has turned upward and that it is now headed for 131.50.
Dollar-Yen: The yen has broken below 116.40 support and this means that it is headed down to 114.30.
November Crude: The market is headed for 58.80 with resistance above the market at 65.00. Ultimately the current drop will carry the market down into the 50-55 range.
December Gold: I think a move below the 500 level is underway. Today resistance is again at 602.
December Silver: I think the market is on its way below 900. Today resistance is at 1150.
Google: Support is at 394 and I think GOOG will soon move above its all time high of 475.
Friday, September 22, 2006
S&P
Here is an hourly bar chart of the December S&P e-mini futures. I last commented on this market yesterday afternoon.
I thought that the market would hold yesterday's low at 1325.50 but as you can see this level has been broken decisively. I think this means that a drop of 25 points or so from 1340 is underway. This would make this reaction as big as the last reaction which ended at 1302.50.
My best guess is that we shall see a typical three phase correction. So I am looking for a low near 1320, followed by a rally of 10 points or so, and then a third phase drop to 1315.
I still think that the market will be trading above the 1400 level later this year.
Guesstimates on September 22, 8:50 am ET
December S&P Futures: I think that yesterday’s low at 1325.50 will be support. The next step up should carry to 1345. Much high prices are likely later this year.
December Bonds: Late yesterday I changed my mind about the bonds and said that they were headed for 112-23, the top of the current box. Support is near the midpoint of the same box at 112-00.
December 10 Year Notes: The market should now reach 108-16 before any reaction of a point or more begins. .
Euro-US Dollar: The market has decisively broken above resistance at 127.60. I think this means that the trend has turned upward and that it is now headed for 131.50.
Dollar-Yen: The yen has broken below 116.40 support and this means that it is headed down to 114.30.
November Crude: The market is headed for 58.80 with resistance above the market at 65.00. Ultimately the current drop will carry the market down into the 50-55 range.
December Gold: I think a move below the 500 level is underway. Today resistance is again at 602.
December Silver: I think the market is on its way below 900. Today resistance is at 1150.
Google: Support is at 394 and I think GOOG will soon move above its all time high of 475.
Thursday, September 21, 2006
T-bond Update
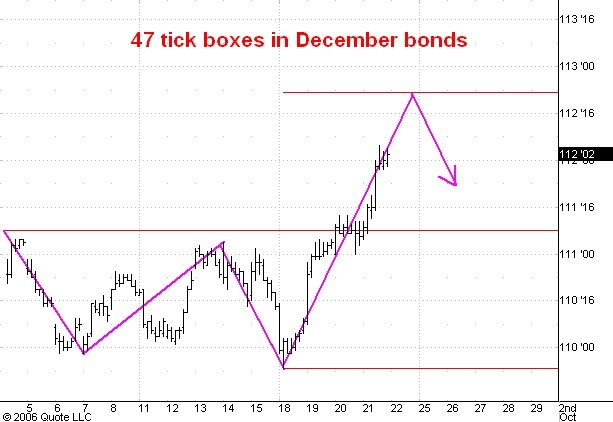
Here is an hourly chart of the December T-bond futures. I commented on this market earlier today.
I thought the market would stop near 111-29 which would have been the midpoint of a 42 tick box that was illustrated in the last post on T-bonds. But the market has spent three hours trading above this level. This tells me that there is more to go on the upside. My best guess now is that we shall see a further rally to 112-23 which is the top of a 47 tick box defined by the last three phase correction.
S&P Update
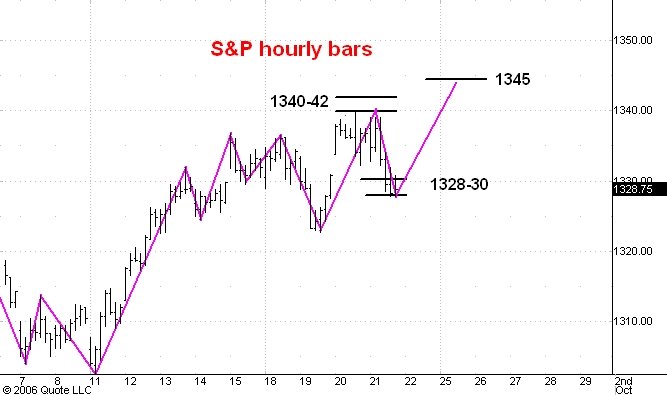
Here is an hourly chart of the December S&P e-mini futures. I commented on this market this morning.
The 1328-30 support zone has been reached; the lowest print so far is 1327.75. I think the next development will be a rally to 1345 or so.
T-bonds

Here is an hourly chart of the December T-bond futures. I last commented on this market here.
The market has reached the midpoint of the box which I thought would be the stopping point of the swing up from the 109-25 level. The next big move from here should be downward. I think that the market will drop into the 106-107 zone over the next few weeks.
S&P
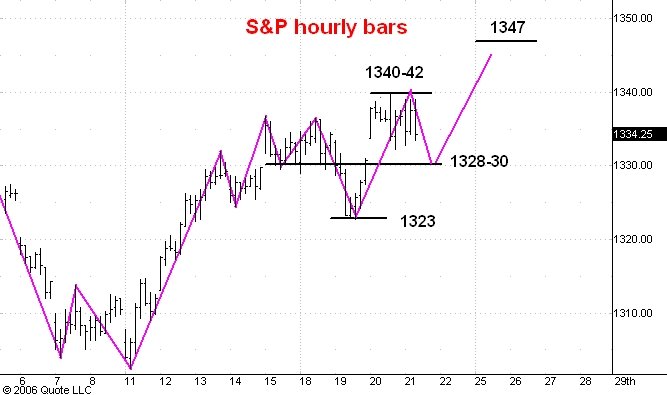
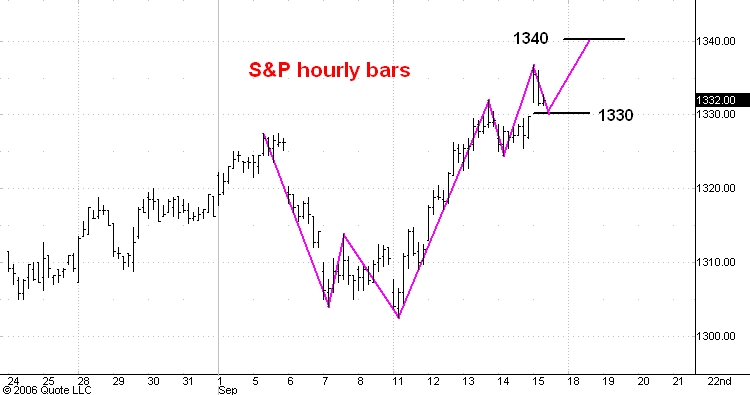
Here is an hourly chart of the December S&P e-mini futures. I last commented on this market yesterday.
Early this morning, before pit trading started, the market hit the 1340 level. That was the bottom edge of the 1340-42 resistance zone. I now think the S&P's are on the way down into the 1328-30 support zone. From there I expect a rally equal in length to the rally from 1323 to 1340. This would put the market in the 1345-47 zone.
Guesstimates on September 21, 8:50 am ET
December S&P Futures: The market’s rally will carry into the 1340-42 zone. From there a break of 10-20 points is likely. Much high prices are likely later this year.
December Bonds: I think the bonds will rally to 111-29 before a move down into the 106-107 range begins.
December 10 Year Notes: The market should rally to 107-24 or so before a move down to 105 begins.
Euro-US Dollar: Resistance is at 127.60. The market is headed down to 122.50.
Dollar-Yen: The yen has broken 116.90 support but I think it will hold the 116.40 level. Next upside target is 120.00. The yen should reach 130 over the next year.
November Crude: The market is headed for 58.80 with resistance above the market at 65.00. Ultimately the current drop will carry the market down into the 50-55 range.
December Gold: I think a move below the 500 level is underway. Today resistance is again at 602.
December Silver: I think the market is on its way below 900. Today resistance is at 1150.
Google: Support is now at 394 and I think GOOG will soon move above its all time high of 475.
Wednesday, September 20, 2006
S&P
Here is an hourly chart of the December S&P e-mini futures. I commented on this chart yesterday afternoon.
As you can see the market is getting close to the 1340-42 target zone. The Fed announcement is due this afternoon at 2:15 pm ET. Until then it is unlikely that the market will move much.
My best guess is that after the news we shall see the S&P's fluctuate within the 1330-1342 zone. It is quite likely that the market will bounce off of the high edge of this zone and drop 10-20 points or so over the next few days.
Nonetheless, after any such reaction is complete I expect much higher prices later this fall. By the end of the year I think we shall see the S&P's trade above the 1400 level.
Guesstimates on September 20, 8:50 am ET
December S&P Futures: The market’s rally will carry into the 1340-42 zone. From there a break of 10-20 points is likely. Much high prices are likely later this year.
December Bonds: I now think the bonds will rally to 111-29 before a move down into the 106-107 range begins.
December 10 Year Notes: The market should rally to 107-24 or so before a move down to 105 begins.
Euro-US Dollar: Resistance is at 127.60. The market is headed down to 122.50.
Dollar-Yen: The yen should hold the 116.90 level. Next upside target is 120.00. The yen should reach 130 over the next year.
November Crude: Switching to the November contract which trades about 0.55 above October. The market is headed for 58.80 with resistance above the market at 65.00. Ultimately the current drop will carry the market down into the 50-55 range.
December Gold: I think a move below the 500 level is underway. Today resistance is at 602.
December Silver: I think the market is on its way below 900. Today resistance is at 1150.
Google: Support is now at 399 and I think GOOG will soon move above its all time high of 475.
Tuesday, September 19, 2006
T-bonds
Here is an hourly chart showing pit trading in the December T-bond futures. I last commented on this market here.
I had thought that the 111-08 level was the end of the rally from the May lows, but today's action has changed the picture. Now the drop from 111-08 looks like a three phase correction. This implies that the 111-08 level will be exceeded soon.
My best guess is that the market will rally about 1/2 a box above 111-08, i.e. to 111-29 or so.
After that I still think the market will drop into the 106-107 zone.
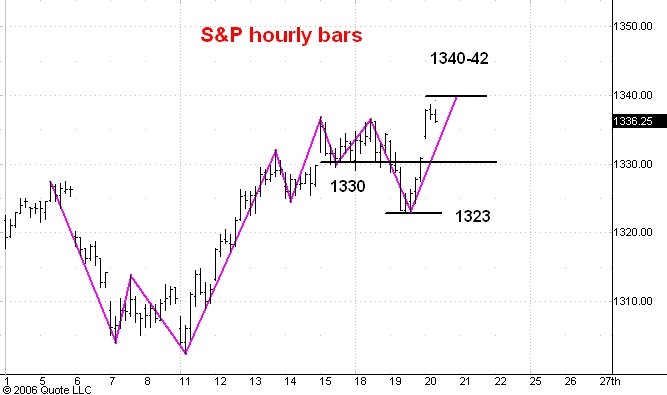
S&P

Here is an hourly chart of the December S&P e-mini futures. I commented on this market yesterday.
In this morning's guesstimate I said that the early morning low at 1327.50 probably ended the drop from the 1336.75 high of September 15. But instead the market has made new reaction lows. I think the drop will find support near the 1323 level and then a rally into the 1340-42 zone will begin.
Guesstimates on September 19, 8:50 am ET
December S&P Futures: The market took a peek below 1229 early this morning, dropping as low as 1327.50. The favorable PPI and housing starts news then kicked off a rally which I think will carry into the 1340-42 zone. From there a break of 10-20 points is likely. Much high prices are likely later this year.
December Bonds: I think the bonds are headed downward to 106-24. Resistance is at 110-28. Short term support is at 109-16.
December 10 Year Notes: The market is headed down to 105. Short term downside target is 106-18. Resistance is at 107-10.
Euro-US Dollar: Resistance is at 127.60. The market is headed down to 122.50.
Dollar-Yen: The yen should hold the 116.90 level. Next upside target is 120.00. The yen should reach 130 over the next year.
October Crude: The market is headed for 58.80 with resistance above the market at 64.50. Ultimately the current drop will carry the market down into the 50-55 range.
December Gold: I think a move below the 500 level is underway. Today resistance is at 602.
December Silver: I think the market is on its way below 900. Today resistance is at 1150.
Google: Support is now at 399 and I think GOOG will soon move above its all time high of 475.
Monday, September 18, 2006
S&P
Here is an hourly chart of the December S&P e-mini futures. I last commented on this market Friday.
As you can see the S&P's have been trading between 1337 and 1329 for two days now. I wouldn't be surprised to see the market take a brief peek below 1329 by dropping to 1327 or so. But my best guess is that the next 10 points from here (1332) will be up, not down.
As you can see the S&P's have been trading between 1337 and 1329 for two days now. I wouldn't be surprised to see the market take a brief peek below 1329 by dropping to 1327 or so. But my best guess is that the next 10 points from here (1332) will be up, not down.

T-bonds
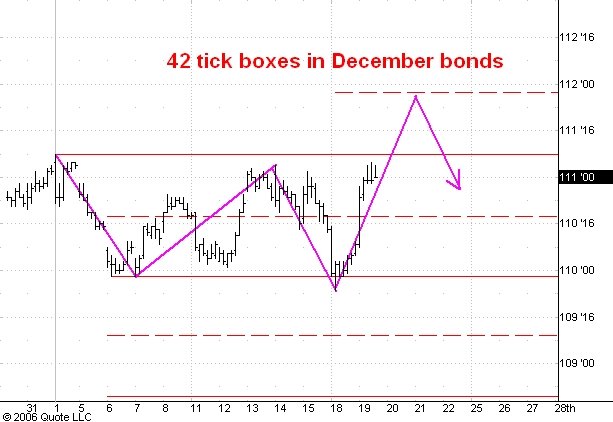
Here is an hourly chart of pit trading in the December T-bond futures. I last commented on this market here.
I believe the market has started a drop that will carry it down into the 106-107 zone over the next few weeks. So far it looks like the decline will be controlled by boxes which are 42 ticks high as I have drawn on the chart.
Once the market makes a low in the 106-107 range I expect it to move up to 115 or so.
Guesstimates on September 18, 8:50 am ET
December S&P Futures: Support is at 1330 and the market should soon move into the 1340-42 range. From there a break of 10-20 points is likely. Much high prices are likely later this year.
December Bonds: I think the bonds are headed downward to 106-24. Resistance is at 110-28. Short term support is at 109-16.
December 10 Year Notes: The market is headed down to 105. Short term downside target is 106-18. Resistance is at 107-10.
Euro-US Dollar: Resistance is at 127.60. The market is headed down to 122.50.
Dollar-Yen: The yen should hold the 116.90 level. Next upside target is 120.00. The yen should reach 130 over the next year.
October Crude: The market is headed for 58.80 with resistance above the market at 64.50. Ultimately the current drop will carry the market down into the 50-55 range.
December Gold: I think a move below the 500 level is underway. Today resistance is at 590.
December Silver: I think the market is on its way below 900. Today resistance is at 1100.
Google: Support is now at 389 and I think GOOG will soon move above its all time high of 475.
Friday, September 15, 2006
S&P
Here is an hourly chart of the December S&P e-mini futures. I last commented on this chart yesterday.
I had thought that the market would develop a third phase drop which would take it to 1323 but instead it rallied sharply above the 1330 level early this morning. I think the correction which started from this morning's high at 1336.75 will find support near 1330. At that level it would equal the length of yesterday's reaction.
The next step up should carry the S&P's into the 1340-42 zone from which point I think a drop of 10-20 points will develop.
I still expect to see the market trade above the 1400 level later this year.
Guesstimates on September 15, 8:50 am ET
December S&P Futures: It looks like the rally to 1340-42 has already started without a drop to 1323 first. However, support is still at 1323. Much high prices are likely later this year.
December Bonds: I think the bonds are headed downward to 106-24. Resistance is at 110-28. Short term support is at 109-16.
December 10 Year Notes: The market is headed down to 105. Short term downside target is 106-18. Resistance is at 107-10.
Euro-US Dollar: Resistance is at 127.60. The market is headed down to 122.50.
Dollar-Yen: The yen should hold the 115.30 level. Next upside target is 119.50. The yen should reach 130 over the next year.
October Crude: The market is headed for 58.80 with a brief rally likely from the 62.00 level. Ultimately the current drop will carry the market down into the 50-55 range.
December Gold: I think a move below the 500 level is underway. Today resistance is at 590.
December Silver: I think the market is on its way below 900. Today resistance is at 1125.
Google: Support is now at 389 and I think GOOG will soon move above its all time high of 475.
Thursday, September 14, 2006
Gold
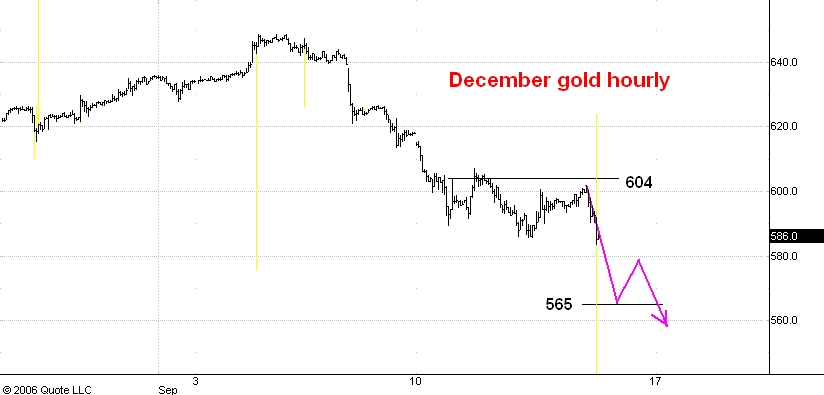
Here is an hourly chart showing pit and electronic trading in December gold futures. I last commented on this market here.
The market is headed much lower from here, probably into the 450-60 range before another multi-week rally can begin. In the meatime resistance above the market stands at 604 and I expect the next 10-20 dollar bounce to start from 565 or so.
S&P
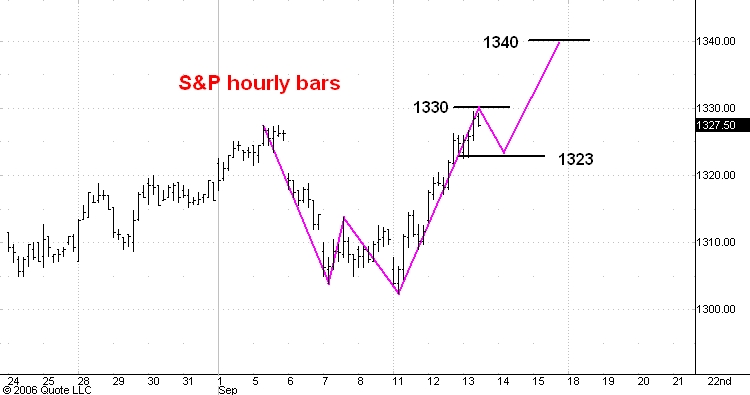
Here is an hourly chart of the December S&P e-mini futures. I last commented on this market yesterday.
I think we have seen at least the first phase of a three phase correction which should carry from yesterday's top at 1332 to support at 1323. The second, upward phase of this correction will probably carry the market up a bit further, probably into the 1329-30 zone and be followed by the third phase drop to 1323.
The next substantial rally should carry from 1323 into the 1340-42 zone.
Crude Oil

Here is a daily chart of October crude oil futures. I last commented on this market here.
I had expected a rally from roughly the 68.00 level but the market has turned out to be even weaker than I expected. The drop from the last top at 78.80 in early August shows no sign of slowing down. So I conclude that the market is probably headed for the 1/2 division point of the next lower box which stands at the 58.80 level. From there I would expect a rally of 5 to 10 dollars to commence.
Guesstimates on September 14, 8:50 am ET
December S&P Futures: Support is now at 1323 and after a brief reaction we should see a renewed rally which will carry the market to 1340. Much high prices are likely later this year.
December Bonds: I think the bonds are headed downward to 106-24. Resistance is at 110-28. Short term support is at 109-16.
December 10 Year Notes: The market is headed down to 105. Short term downside target is 106-18. Resistance is at 107-10.
Euro-US Dollar: Resistance is at 127.60. The market is headed down to 122.50.
Dollar-Yen: The yen should hold the 115.30 level. Next upside target is 119.50. The yen should reach 130 over the next year.
October Crude: The 64.00 level is support. Ultimately the current drop will carry the market down into the 50-55 range.
December Gold: I think a move below the 500 level is underway. Today resistance is at 604.
December Silver: I think the market is on its way below 900. Today resistance is at 1150.
Google: Support is now at 389 and I think GOOG will soon move above its all time high of 475.
Wednesday, September 13, 2006
Projecting the Next Top

Here is a weekly chart of the cash S&P 500 index. I want to use it to illustrate a simple minded but effective technique for estimating the probable length of any trend.
The objective of any such estimate is to get you "in the right ballpark", the ballpark in which the extreme point of the trend will be playing. Making such estimates is as much art as science. But those who feel uncomfortable with the notion of speculation as an art should probably not be speculators.
In any event, the basic idea is to look for analogues of the current market situation in the market's recent history. At the moment I think that a strong uptrend has begun from a low point this past June. The June low (1219 in the cash S&P 500) occurred amidst oversold conditions and levels of public pessimism very comparable to the conditions which prevailed at the recent lows in August 2004, April 2005, and October 2005. On this basis I am willing to bet that the upmove from the June 2006 low will be comparable to the upmoves from one of these three previous lows.
In fact, I think that the level of bearish sentiment was so high at the June 2006 low that its closest analogues are the lows of August 2004 and October 2006. From each of these lows the market moved upward at least 158 points and the uptrend continued for at least 6 months. So I am willing to guess that the advance from the June low will carry upward at least 158 points (i.e to at least the 1377 level) and will last at least 6 months (i.e into December).
In fact I have been guessing that we shall see the S&P trade over the 1400 level by the end of the year. A move up from the June 2006 low that equals the August 2004-March 2005 advance in percentage terms would carry the S&P to 1414.
S&P
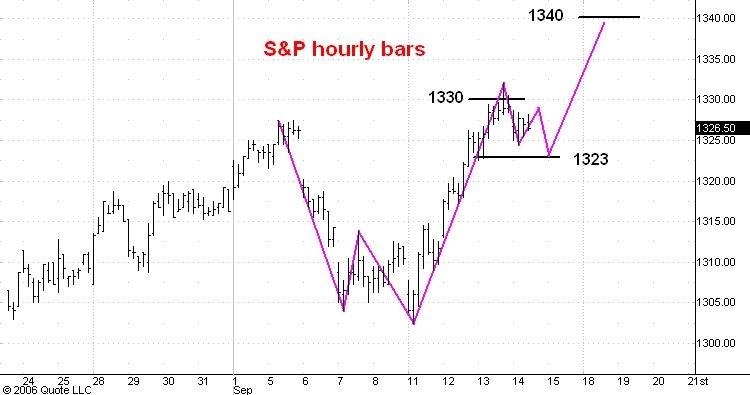
Here is an hourly bar chart of the December S&P e-mini futures. I commented on this chart yesterday afternoon.
So far the advance has been developing pretty much as anticipated. This morning the market traded as high as 1329.50, a new bull market high for the December contract. I am guessing that it will reach the 1330-31 zone before a reaction sets in. The first reaction should be a small one and I think it will probably halt near 1323 support. The next upward phase is likely to carry the market to 1340 or a point or two higher.
Guesstimates on September 13, 7:20 am ET
December S&P Futures: We should see a 1330 print today. Support is at 1315. The 1340 level should be reached in a week or two. Much high prices are likely later this year.
December Bonds: I think the bonds are headed downward to 106-24. Resistance is at 110-28. Short term support is at 109-16.
December 10 Year Notes: The market is headed down to 105. Short term downside target is 106-18. Resistance is at 107-10.
Euro-US Dollar: Resistance is now at 127.60. The market is headed down to 122.50.
Dollar-Yen: The yen should hold the 115.30 level. Next upside target is 119.50. The yen should reach 130 over the next year.
October Crude: The market has been weaker than I expected. The 64.00 level is now support. Ultimately the current drop will carry the market down into the 50-55 range.
December Gold: I think a move below the 500 level is underway.
December Silver: I think the market is on its way below 900.
Google: Support is now at 369 and I think GOOG will soon move above its all time high of 475.
Tuesday, September 12, 2006
S&P Headed Up

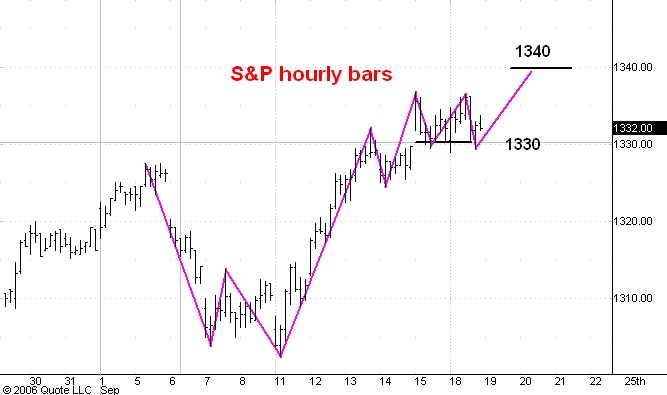
Here is an hourly chart of the December S&P e-mini futures.
In the post I made about 90 minutes ago I explained why I had changed my mind about the short term trend direction and believed it was now upward. On this hourly bar chart I have drawn the resistance and support levels which I believe will control the market's action over the next couple of weeks.
First of all, I expect a minor hesitation of a day or two once the market reaches the 1330 level, just above its September 5 top and just below the May 5 top. Support for any reaction from that level will be a 1315.
The next drop of any significance will probably develop from about the 1340 level, although even then I doubt we shall see more than a 25 point break.
I still believe that we shall see the S&P trade above 1400 by the end of the year.
S&P Update
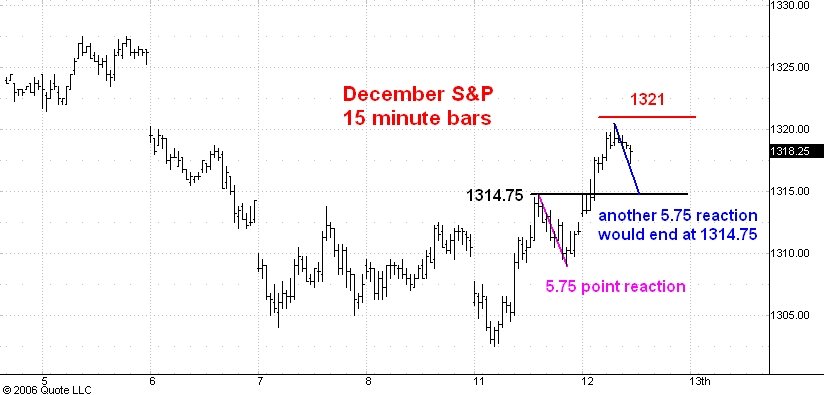
Here is a 15 minute bar chart of the December S&P futures.
In my post earlier this morning I said that should the market hit the 1321 level I would conclude that the reaction ended at 1302.50 and that the short term trend would now be upward. I have since been mulling over the significance of the fact that that the S&P's moved a full 5.50 points above what should have been ideal resistance at 1315 and did so in a decisive fashion.
The first observation I want to make is that another break equal to yesterday afternoon's drop of 5.75 points would put the market right at its 1314.75 high, an obvious support point. This suggests that indeed the trend may well have already turned upward.
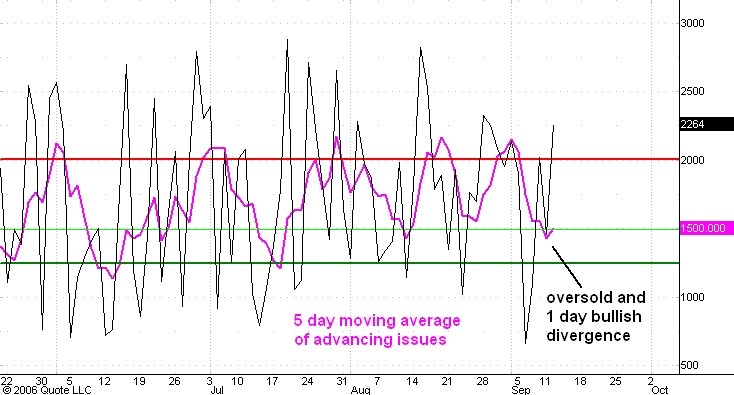
The second observation concerns the daily count of the number of advancing issues on the New York Stock Exchange. This is the second chart above this post. The daily count is the black line and the 5 day moving average is the pink line.
Notice that yesterday's reaction low occurred together with a higher low in the daily count of the number of advancing issues. This is a minor bullish divergence. Note also that this minor divergence occurred with the 5 day moving average in an "oversold postion" and below its last low. These facts are further evidence that yesterday's low at 1302.50 ended the drop from 1327.
Since I am generally bullish on the S&P the above considerations have convinced me that the 1302.50 low will hold. In fact I doubt that the reaction from this morning's high at 1320.50 will go even as far as 1315.00. I think the next stop will be the 1330 level and this should only be temporary resistance.
S&P
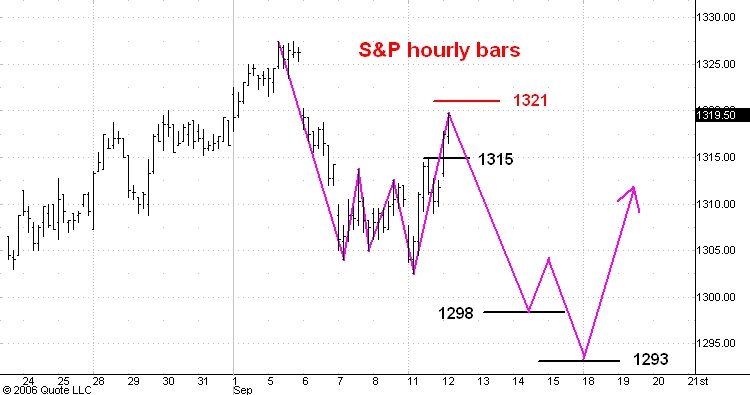
Here is an hourly chart of the S&P e-mini futures. I last commented on this market here.
The market has rallied as far as 1319.50 so far, well above the 1315-17 zone mentioned in this morning's guesstimate. If I am reading the market correctly a move down to 1298 and then to 1293 should begin right here.
Should the market instead hit the 1321 level I will conclude that the correction actually ended at yesterday's 1302.50 low yesterday and that the S&P's will soon trade above 1330.
Guesstimates on September 12, 8:50 am ET
December S&P Futures: There is still a good chance that the market will make it into the 1315-1317 zone today before it begins to drop to the 1293 correction target. Much high prices are likely later this year.
December Bonds: I think the bonds are headed downward to 106-24. Resistance is at 110-28. Short term support is at 109-16.
December 10 Year Notes: The market is headed down to 105. Short term downside target is 106-18. Resistance is at 107-10.
Euro-US Dollar: Resistance is now at 127.60. The market is headed down to 122.50.
Dollar-Yen: The yen should hold the 115.30 level. Next upside target is 119.50. The yen should reach 130 over the next year.
October Crude: The market has been weaker than I expected. The 64.00 level is now support. Ultimately the current drop will carry the market down into the 50-55 range.
December Gold: I think a move below the 500 level is underway.
December Silver: I think the rally from the June low around 945 is complete and that the market is on its way below 900.
Google: Support is now at 369 and I think GOOG will soon move above its all time high of 475.
Monday, September 11, 2006
S&P Update
Here is an hourly chart of the December S&P e-mini futures. I commented on this chart earlier today.
I had thought that today's weak open was the harbringer of the third third phase of the correction which started from the 1327 level in the December contract last Tuesday. I now expect this correction to carry the market down to 1293 or so.
Instead of bouncing off of the 1308 level the market blew right through and so far has traded as high as 1312.25. My best guess now is that the rally will continue up to my original target of 1315 or perhaps a point or two higher. After that I still think we shall see a three phase break down to 1293 followed by a very strong move up to new highs for the bull market.
S&P

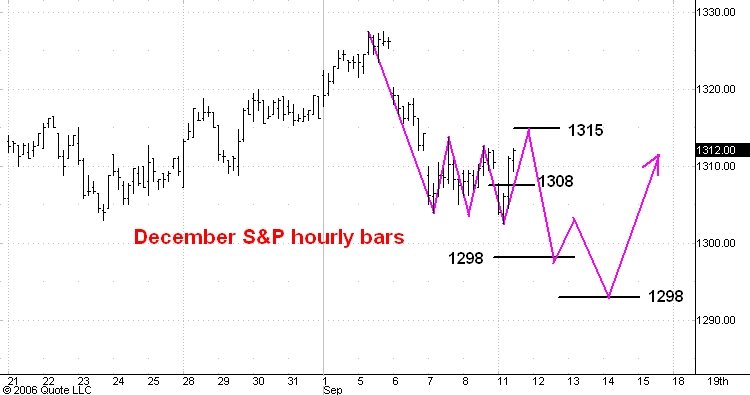
Here is an hourly chart of the December S&P e-mini futures. I last commented on this market here.
I think the market is on its way to 1298 and then to 1293. Meantime resistance today is 1308.
After the 1293 level is reached I expect to see a strong rally which will carry the market above the 1330 level. Moreover, I think that we shall see the futures trade at 1400 by the end of the year.
Guesstimates on September 11, 8:50 am ET
December S&P Futures: The market is now headed for 1298. The fact that it couldn’t make it up to 1315 tells me that the low of the correction will probably be lower than I originally expected: 1293 or so vs. 1298. Much high prices are likely later this year.
December Bonds: I think the bonds are headed downward to 106-24. Resistance is at 110-28. Short term support is at 109-16.
December 10 Year Notes: The market is headed down to 105. Short term downside target is 106-18. Resistance is at 107-10.
Euro-US Dollar: Resistance is now at 127.60. The market is headed down to 122.50.
Dollar-Yen: The yen should hold the 115.30 level. Next upside target is 119.50. The yen should reach 130 over the next year.
October Crude: The market has been weaker than I expected. The 64.00 level is now support. Ultimately the current drop will carry the market down into the 50-55 range.
December Gold: I think a move below the 500 level is underway.
December Silver: I think the rally from the June low around 945 is complete and that the market is on its way below 900.
Google: Support is now at 369 and I think GOOG will soon move above its all time high of 475.
Friday, September 08, 2006
Silver
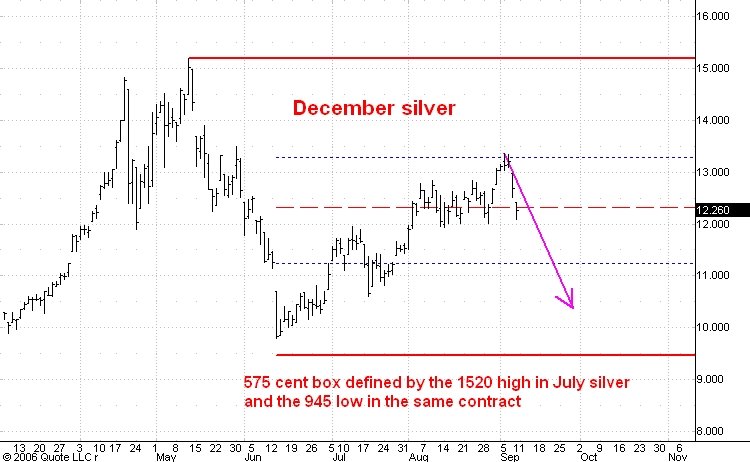
Here is a daily chart of December silver futures. I last commented on this market here.
I have drawn solid red lines to indicate the boundaries of a 575 cent box defined by the 1520 high and the 945 low in July Silver. After the low in June the market has managed to rally to the 2/3 division point of the box (higher of the two blue dotted lines). The break of the past two days has convinced me that the rally is over and that an extended drop has started.
The next downside target is the 1/2 division point of the next lower box. This is the 660 level.
Gold
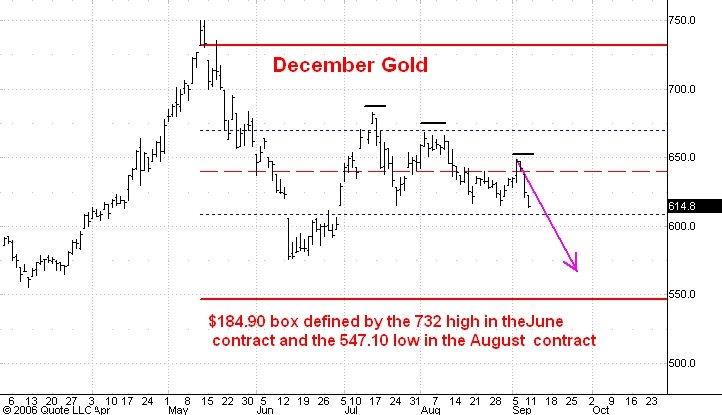
Here is a daily chart of December gold futures. I last commented on this market here.
On this chart I have drawn the box which is defined by the May-June break in gold futures. The top was at 732 in the June contract and the low was at 547.10 in the August contract, giving a box size of 184.90.
The market has been oscillating roughly between the 1/3 and the 2/3 division points of this box (blue dotted lines). The break during the past two days has convince me that we have seen three consecutive lower tops in gold (black lines). This is a very bearish indication and makes me think that the market is now headed below the 500 level.
The 1/2 division point of the next lower box is at 455 and I think this is a reasonable target for this drop.
Guesstimates on September 8, 8:50 am ET
December S&P Futures: Switching to the December contract which trades about 11 points above September. I expect the market to rally to 1315 or so today and then begin a third phase drop to 1298. Much high prices are likely later this year.
December Bonds: I think the bonds are headed downward to 106-24. Resistance is at 110-20. Short term support is at 109-16.
December 10 Year Notes: The market is headed down to 105. Short term downside target is 106-18. Resistance is at 107-10.
Euro-US Dollar: The market has sagged below the 127.30 level and I conclude that a substantial drop is underway. Initial downside target is 122.50.
Dollar-Yen: The yen should hold the 115.30 level. Next upside target is 119.50. The yen should reach 130 over the next year.
October Crude: The market has dropped to the bottom of the current box at 67.20. I now expect a rally to 72.50 or so.
December Gold: It looks like gold made a second lower top earlier this week so I am abandoning my 665-70 rally target. I think a move below the 500 level is underway.
December Silver: Earlier this week silver rallied to within 15 cents of the 1350 upside target but now has dropped more than a dollar in just a couple of days. I think the rally from the June low around 945 is complete and that the market is on its way below 900.
Google: Support is now at 369 and I think GOOG will soon move above its all time high of 475.
Thursday, September 07, 2006
S&P Update
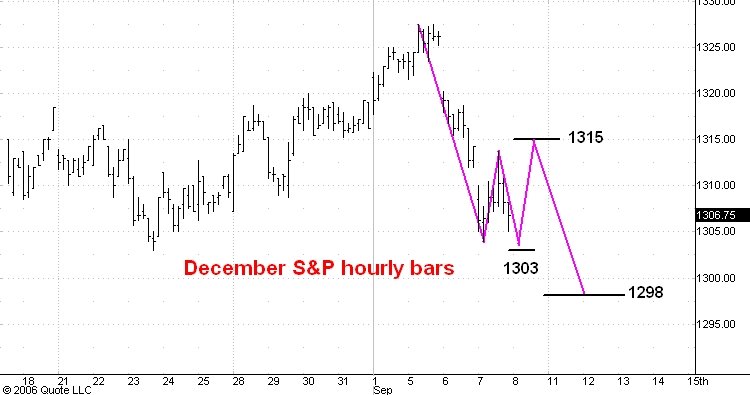
Here is an updated hourly chart of the December S&P futures. I commented on this chart this morning.
I have a strong suspicion that the rally that began from the morning low at 1304 and carried to 1313.75 early this afternoon is only the first phase of a three phase rally. If I am correct then the market will hold support at 1303 and then rally a little above today's high, getting close to or a little above resistance at 1315. One reason for my suspicion is that the number of advancing issues today is visibly higher than yesterday's number despite the fact that the market has been trading below yesterday's close all day.
In any event once the rally is complete I expect a third phase drop to 1298 and then a move above the 1330 level.
S&P
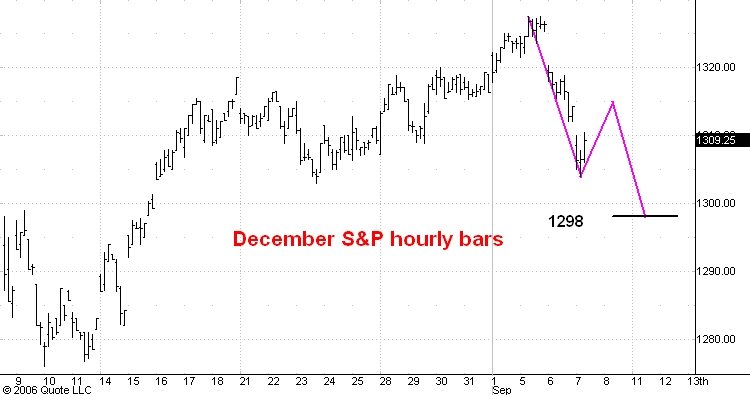
Today trading activity switched into the December contract from the September contract in the S&P e-mini futures. The December contract is trading about 11 points over September.
I last commented on this market yesterday.
This morning's low at 1293 in the September contract and 1304 in the December contract was probably the end of the first phase of the ongoing three phase correction. The second phase rally will probably carry the December contract close to 1315 and be followed by a third phase drop to a correction low near 1298. Once the 1298 level is reached I shall start looking for a rally to new bull market highs above 1330.
Guesstimates on September 7, 8:50 am ET
September S&P Futures: The dropped as low as 1296.50 this morning but I think this is still only the first phase of a longer correction which should end around the 1291 level. The next phase will be a rally from roughly this morning’s low into the 1303-08 range and them the third phase drop to 1291 will follow. Much high prices are likely later this year.
December Bonds: I think the bonds are headed downward to 106-24. Resistance is at 110-14. Short term support is at 109-16.
December 10 Year Notes: The market is headed down to 105. Short term downside target is 106-18. Resistance is at 107-04.
Euro-US Dollar: The 127.30 level has been reached this morning. I shall stick with my expectation of a move up to 130.60 as long as this support holds.
Dollar-Yen: The yen should hold the 115.30 level. Next upside target is 119.50. The yen should reach 130 over the next year.
October Crude: The market has dropped a little below 68.00 support and has nearly reached the bottom of the current box at 67.20. I now expect a rally to 72.50 or so.
December Gold: I am still short term bullish on gold and expect it to rally into the 665-670 range before the market turns much lower.
December Silver: I am still short term bullish on silver but the market is getting close to the 1350 upside target. After this rally a drop to below 900 should develop.
Google: Support is now at 369 and I think GOOG will soon move above its all time high of 475.
Wednesday, September 06, 2006
S&P
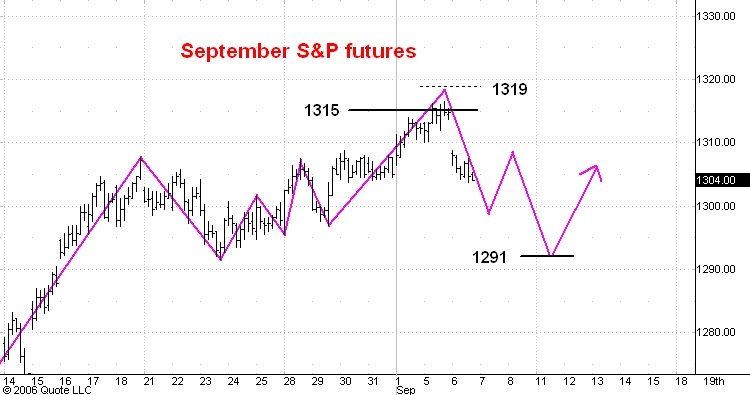
Here is an hourly chart of the September S&P e-mini futures. I last commented on this market here.
So far the market is following the script for a three phase correction ending near 1291. In the ideal pattern, the first phase would carry to 1300 or a little below. Then the second phase rally would retrace about half of the initial drop and be followed by the third phase down to 1291.
The most important thing to remember is that this decline is only a correction within a bigger uptrend. I still expect the market to trade above the 1400 level by the end of the year.
Crude Oil
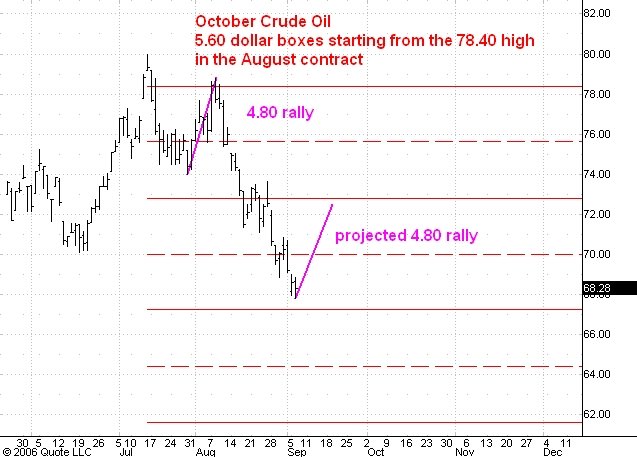
Here is a daily chart of October crude oil futures. I last commented on this market here.
As you can see the support level at 68.00 has been reached. On this chart I have drawn the boxes which I think are controlling the drop from the July 14 all time high in crude oil. In the August 2006 contract this high was 78.40. The subsequent break carried to a low of 72.80 in the September contract and thus defined a box whose height is $5.60.
The bottom of the current box is at 67.20. I think we will now see a rally about equal to the last rally which was $4.80. It should carry the market close to the top of the current box which stands at 72.80. After this rally the market should drop well below the 68.00 level.
Guesstimates on September 6, 8:50 am ET
September S&P Futures: The market stalled twice at 1316.50 yesterday and couldn’t quite make it to the day target of 1319. Nonetheless the 1315 short term resistance level has held and today’s early action indicates that the three phase move down to 1291 has begun. Much high prices are likely later this year.
December Bonds: I think the next big move in the bonds will be downward to 106-24. Resistance is at 111-00. Short term support is at 109-16.
December 10 Year Notes: The market is headed down to 105. Short term downside target is 106-18. Resistance is at 107-10.
Euro-US Dollar: The 127.30 level is still support and I expect a move to 130.60 before that support is broken.
Dollar-Yen: The yen should hold the 115.30 level. Next upside target is 119.50. The yen should reach 130 over the next year.
October Crude: The market has reached the 68.00 target and I think the next significant development will be a rally into the 73-75 zone.
December Gold: I am still short term bullish on gold and expect it to rally into the 665-670 range before the market turns much lower.
December Silver: I am still short term bullish on silver but the market is getting close to the 1350 upside target. After this rally a drop to below 900 should develop.
Google: Support is now at 369 and I think GOOG will soon move above its all time high of 475.
Tuesday, September 05, 2006
S&P

Here is an hourly chart of the September S&P e-mini futures. I last commented on this chart Friday.
In electronic trading Sunday night the market hit the 1315 short term upside target and Monday rallied as high as 1316.75. In regular hours trading today we saw a modest reaction to 1310 and now another rally has begun. My best guess is that the market will make a high today near 1319 and then begin its break to 1291.
Guesstimates on September 5, 8:50 am ET
September S&P Futures: The 1315 target level has been reached. The next development should be a three phase break to 1291 followed by a move above the 1330 level. Much high prices are likely later this year.
December Bonds: I think the next big move in the bonds will be downward to 106-24. Resistance is at 111-00.
December 10 Year Notes: The market will soon begin a move down to 105. Resistance is at 107-10.
Euro-US Dollar: The 127.30 level is still support and I expect a move to 130.60 before a substantial down move starts.
Dollar-Yen: The yen broke support near 116.30 but should hold the 115.30 level. Next upside target is 119.50. The yen should reach 130 over the next year.
October Crude: The market has reached the 68.00 target and I think the next significant development will be a rally into the 73-75 zone.
December Gold: I am still short term bullish on gold and expect it to rally into the 665-670 range before the market turns much lower.
December Silver: I am still short term bullish on silver but the market is getting close to the 1350 upside target. After this rally a drop to below 900 should develop.
Google: Support is now at 369 and I think GOOG will soon move above its all time high of 475.
Friday, September 01, 2006
S&P
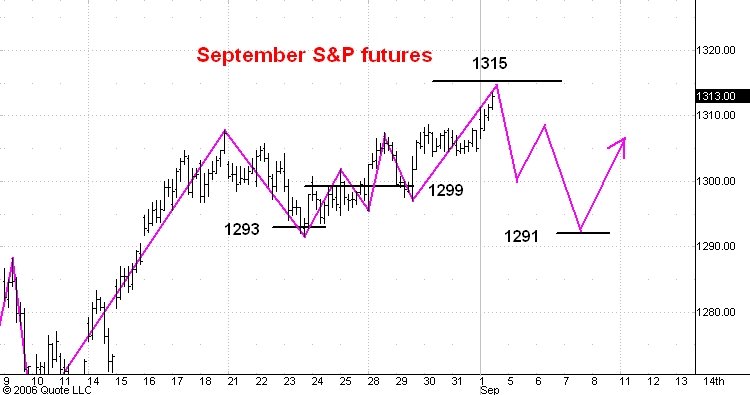
Here is an hourly chart of the September S&P e-mini futures. I last commented on this chart here.
As you can see the market has nearly reached the 1315 target and I think that next week will see at least the first phase of a three phase corrective move. I doubt that any correction will drop the market below 1291. In any event the subsequent up move should carry futures above 1331, the bull market high so far.
I still think that the futures will trade above 1400 by the end of the year.
Guesstimates on September 1, 8:50 am ET
September S&P Futures: Support is at 1299. The market will probably rally to 1315 or so, a little above my initial estimate of resistance in the 1309-12 zone. After that a 25 point break should develop. Much high prices are likely later this year.
December Bonds: The market has gone about 10 ticks higher than I expected. Still I think the next big move in the bonds will be downward to 106-24. Resistance is at 111-00.
December 10 Year Notes: The market will soon begin a move down to 105. Resistance is at 107-10.
Euro-US Dollar: The 127.30 level is still support and I expect a move to 130.60 before a substantial down move starts.
Dollar-Yen: The yen is on the way to 119.50. Support is at 116.30. The yen should reach 130 over the next year.
October Crude: The market dropped into the 68.00-69.00 zone Wednesday and I think the next significant development will be a rally into the 73-75 zone.
December Gold: I am still short term bullish on gold and expect it to rally into the 665-670 range before the market turns much lower.
December Silver: Switching to the December contract today. I am still short term bullish on silver and think that a move up to 1350 or so in the cards. After this rally a drop to below 900 should develop.
Google: Support is now at 369 and I think GOOG will soon move above its all time high of 475.
Subscribe to:
Posts (Atom)