The hourly chart you see above depicts my updated box analysis of the June T-bond futures. My last comment on this market was just after the employment number came out on May 6. I said that the bonds looked like a buy near 113-28 based on my box analysis.
The market still appears to be headed up to the top of another 46 tick box at 116-16. This morning the PPI number came out higher than the consensus estimate and housing starts were strong. Despite this bearish news the market has rallied strongly and this is good evidence that the uptrend which began late in March 2005 from the 109 level is still intact.
I think we will see t-bond futures trading in the 118-120 range within a couple of months before the rally from 109 exhausts itself. See my 2005 bond market forecast for more details.
Tuesday, May 17, 2005


Short Term S&P Outlook
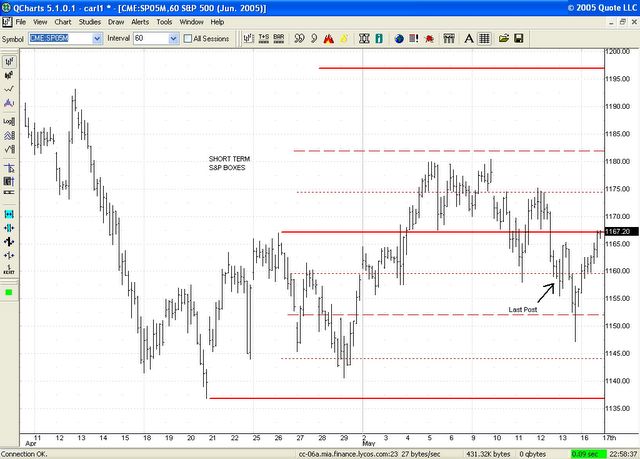
The hourly bar chart above depicts my short term box analysis for the June S&P 500 futures. The market established a low at 1137 on April 20 (the overnight low of 1136 - not shown on this chart - actually occurred on April 18). I think an uptrend began there and will eventually carry the S&P to the 1350 level by the end of this year.
In any case the market seems to have established a 30 point short term box with the top of the first box at 1167 and the top of the second box at 1197. In my May 12 post on the short term S&P outlook (time and price marked by an arrow on the chart) I said that the reaction would continue to the halfway point of the first box at 1152 but would end there. In the event the market dropped briefly below 1152, closed the day above that level and has rallied since.
At this juncture it looks to me like the market is headed for the top of the second box at 1197. I think it likely that we will see reactions of only 6 to 8 points (1/4 the size of the short term box) on the way to 1197. From 1197 a bigger reaction, probably down to the halfway point of the second box around 1182, would be the normal expectation.
In any case the market seems to have established a 30 point short term box with the top of the first box at 1167 and the top of the second box at 1197. In my May 12 post on the short term S&P outlook (time and price marked by an arrow on the chart) I said that the reaction would continue to the halfway point of the first box at 1152 but would end there. In the event the market dropped briefly below 1152, closed the day above that level and has rallied since.
At this juncture it looks to me like the market is headed for the top of the second box at 1197. I think it likely that we will see reactions of only 6 to 8 points (1/4 the size of the short term box) on the way to 1197. From 1197 a bigger reaction, probably down to the halfway point of the second box around 1182, would be the normal expectation.

Monday, May 16, 2005

Three Peaks and Domed House in the Dow
For the past year I have been following the evolution of one of George Lindsay's Three Peaks and a Domed House formations in the Dow. In my 2003 and 2004 stock market forecasts I wrote that I expected such a formation to develop during the anticipated 2003-2005 bull market and in my 2005 forecast I identified such a formation in the Dow and analyzed its implications in more detail.
(Those of you who want to learn more about George Lindsay's approach to market forecasting should call Investor's Intelligence at (914) 632 - 0422 (New York state in the USA) and ask for a copy of "Selected Articles by the late George Lindsay".)
Once a Three Peaks and Domed House formation has been identified in its early stages it has great forecasting value because the market follows pretty much the same pattern time after time with minor variations. If the formation is a "major" one in Lindsay's terminology it usually lasts two years from start to finish thus giving it added forecasting value. Lindsay once estimated that the stock market in the US has historically spent about 60% of the time tracing out Three Peaks and Dome House formations.
The main characteristic of the market when a 3P-DH is developing is that the averages spend most of the time in trading ranges. Only occasionally will definite trends up or down develop and these typically last only a few weeks. This has been exactly the behavior of the Dow and S&P over the past 14 months.
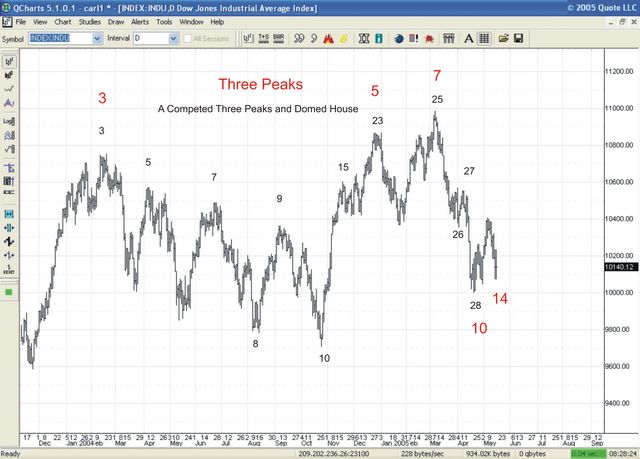
The first chart you see above this post is the ideal model of a major, Three Peaks and Domed House Formation. The three peaks are labeled 3,5 and 7, while the top of the domed house is labeled 23. In a major formation peak 7 typically occurs six to ten months after peak 3. Moreover, point 23 typically occurs an average of seven months and ten days after point 14. For a more detailed discussion of the variations upon this theme one encounters check out Lindsay's original article in the booklet from Investor's Intelligence cited earlier in this post.
In my view the Dow Industrials have developed not one but two Three Peaks and Domed House formations during the past year.
The first one I discussed in my 2005 Stock Market Forecast. In that forecast I said that the three peaks were February, June and September of 2004. But since I now think this formation is only a minor formation I have relabeled the three peaks as the points 3,5 and 7 in black numerals you see in the second chart above. In this interpretation these three peaks are only separated by four months, thus making the formation a minor one. This minor formation probably ended at the April 2005 low.
There is also a major three peaks developing currently. It is labeled by the red numerals in the chart. I think that we saw point 14 on May 13. If so we can add seven months ten days to that date and estimate that point 23 will occur on December 23 of this year. I like this projection because it fits in more neatly with the implications of the other Lindsay methods which were discussed in my 2005 forecast.
So we conclude that the next seven months should be very bullish ones for the Dow.
(Those of you who want to learn more about George Lindsay's approach to market forecasting should call Investor's Intelligence at (914) 632 - 0422 (New York state in the USA) and ask for a copy of "Selected Articles by the late George Lindsay".)
Once a Three Peaks and Domed House formation has been identified in its early stages it has great forecasting value because the market follows pretty much the same pattern time after time with minor variations. If the formation is a "major" one in Lindsay's terminology it usually lasts two years from start to finish thus giving it added forecasting value. Lindsay once estimated that the stock market in the US has historically spent about 60% of the time tracing out Three Peaks and Dome House formations.
The main characteristic of the market when a 3P-DH is developing is that the averages spend most of the time in trading ranges. Only occasionally will definite trends up or down develop and these typically last only a few weeks. This has been exactly the behavior of the Dow and S&P over the past 14 months.
The first chart you see above this post is the ideal model of a major, Three Peaks and Domed House Formation. The three peaks are labeled 3,5 and 7, while the top of the domed house is labeled 23. In a major formation peak 7 typically occurs six to ten months after peak 3. Moreover, point 23 typically occurs an average of seven months and ten days after point 14. For a more detailed discussion of the variations upon this theme one encounters check out Lindsay's original article in the booklet from Investor's Intelligence cited earlier in this post.
In my view the Dow Industrials have developed not one but two Three Peaks and Domed House formations during the past year.
The first one I discussed in my 2005 Stock Market Forecast. In that forecast I said that the three peaks were February, June and September of 2004. But since I now think this formation is only a minor formation I have relabeled the three peaks as the points 3,5 and 7 in black numerals you see in the second chart above. In this interpretation these three peaks are only separated by four months, thus making the formation a minor one. This minor formation probably ended at the April 2005 low.
There is also a major three peaks developing currently. It is labeled by the red numerals in the chart. I think that we saw point 14 on May 13. If so we can add seven months ten days to that date and estimate that point 23 will occur on December 23 of this year. I like this projection because it fits in more neatly with the implications of the other Lindsay methods which were discussed in my 2005 forecast.
So we conclude that the next seven months should be very bullish ones for the Dow.
Sunday, May 15, 2005

Long Term Outlook for US Dollar
I'd like to take a look at the "big picture" for the US dollar. The chart you see above is a monthly chart of the US Dollar index. The two solid horizontal lines are drawn at the dollar index's historical high of 164.72 and its historical low of 78.19. The dashed line is the 1/2 point of this price box while the dotted lines are the 1/4 and 3/4 points.
I think an estimate of where a market stands on the overvalued- undervalued spectrum has to be the first step in making an educated guess of its likely long term trend. One has to remember that markets typically go from undervalued to overvalued and then back to undervalued, etc. Only rarely will a long term trend stop anywhere near the midpoint of the value range, i.e. at "fair value".
With this in mind look more carefully at the dollar index chart. One immediately notices that with the exception of a three year period in the mid-1980's the dollar index has traded in a range between 78 and 121. I judge this to be the value range for the dollar index. Its midpoint is the 100 level and I like to think of this midpoint as "fair value".
I conclude that since the dollar has been trading near the low end of this 78 to 121 range for all of 2005 it is definitely undervalued.
Having determined that the dollar is undervalued, I next want to check the state of public sentiment towards the dollar. See an earlier post on this subject here. There can be no question that the general expectation is that the dollar must inevitably drop from current levels, short term rallies notwithstanding.
From the facts that the dollar is undervalued and that public sentiment is bearish I conclude that its long term trend has turned upward. This means that the dollar index over the next few years should move up close to the 121 level, i.e. to the overvalued level.
Next I want to focus on details that can lead to a more precise estimate of the duration and extent of the expected upswing. Looking at the chart we see that there have been five mini-bull market in the index. Each has carried it up about 17-20 points and lasted anywhere from six months to two years. There were two major bull markets in the index. The first lasted a little more than six years and carried the index up 80 points while the second also lasted 6 years and carried the index up 40 points.
In a previous post I have already explained why Lindsay's mirror image chart for the dollar index is predicting a long term top for 2010. Putting these facts together leads to the following conclusion.
The general trend for the dollar index over the next five to six years will be upward. There should be one and more likely two mini-bull markets of 17-20 points in the index before a more extended upward trend of about 40 points and two years develops. The high of this 40 point upward trend will probably again be near the 121 level and should occur in 2010
I think an estimate of where a market stands on the overvalued- undervalued spectrum has to be the first step in making an educated guess of its likely long term trend. One has to remember that markets typically go from undervalued to overvalued and then back to undervalued, etc. Only rarely will a long term trend stop anywhere near the midpoint of the value range, i.e. at "fair value".
With this in mind look more carefully at the dollar index chart. One immediately notices that with the exception of a three year period in the mid-1980's the dollar index has traded in a range between 78 and 121. I judge this to be the value range for the dollar index. Its midpoint is the 100 level and I like to think of this midpoint as "fair value".
I conclude that since the dollar has been trading near the low end of this 78 to 121 range for all of 2005 it is definitely undervalued.
Having determined that the dollar is undervalued, I next want to check the state of public sentiment towards the dollar. See an earlier post on this subject here. There can be no question that the general expectation is that the dollar must inevitably drop from current levels, short term rallies notwithstanding.
From the facts that the dollar is undervalued and that public sentiment is bearish I conclude that its long term trend has turned upward. This means that the dollar index over the next few years should move up close to the 121 level, i.e. to the overvalued level.
Next I want to focus on details that can lead to a more precise estimate of the duration and extent of the expected upswing. Looking at the chart we see that there have been five mini-bull market in the index. Each has carried it up about 17-20 points and lasted anywhere from six months to two years. There were two major bull markets in the index. The first lasted a little more than six years and carried the index up 80 points while the second also lasted 6 years and carried the index up 40 points.
In a previous post I have already explained why Lindsay's mirror image chart for the dollar index is predicting a long term top for 2010. Putting these facts together leads to the following conclusion.
The general trend for the dollar index over the next five to six years will be upward. There should be one and more likely two mini-bull markets of 17-20 points in the index before a more extended upward trend of about 40 points and two years develops. The high of this 40 point upward trend will probably again be near the 121 level and should occur in 2010
Saturday, May 14, 2005
Index of Currency Posts
Here are posts about currency markets:
POSTS IN 2007
US Dollar - December 3
US Dollar - November 7
US Dollar Index - August 16
US Dollar and US Assets - May 22
POSTS IN 2006
The New York Times - Bearish to the Bone - December 6
The US Dollar - December 4
A Note on the Yen - November 7
Euro-USD and USD-Yen - September 28
USD \ Euro - July 27
US Dollar and the New York Times - July 18
Euro-Dollar - June 30
Dollar-Yen - June 30
Euro-USD and USD-Yen - June 29
Euro-USD - June 28
Yen and Euro - June 12
Us Dollar - June 6
US Dollar - May 22
Euro-US Dollar - May 17
Dollar Yen - May 15
Euro-USD - May 10
Dollar-Yen - April 27
Euro USD - April 27
Euro USD - April 7
US Dollar Index - April 4
US Dollar / Euro - April 3
US Dollar / Euro - March 28
US Dollar / Euro - March 23
US Dollar / Euro - March 21
US Dollar / Euro - March 16
Cash USD - euro - March 14
US Dollar/Euro - March 6
USD/Euro - February 24
Cash Euro-USD - February 10
Eurocurrency - February 8
US Dollar - January 30
US Dollar - January 26
Eurocurrency - January 23
US Dollar - January 18
Eurocurrency - January 18
US Dollar and the Eurocurrency - January 11
US Dollar Index - January 5
Eurocurrency - January 5
POSTS IN 2005
US Dollar - December 22
Eurocurrency - December 22
US Dollar - December 21
Eurocurrency - December 21
US Dollar - December 20
Eurocurrency - December 20
US Dollar Index - December 15
Eurocurrency - December 15
Eurocurrency - December 13
US Dollar - December 13
US Dollar Index - December 12
Eurocurrency - November 30
Eurocurrency - November 28
Eurocurrency - November 22
Eurocurrency - November 15
Eurocurrency - November 8
Eurocurrency - November 4
Eurocurrency - November 2
Eurocurrency - October 26
Eurocurrency - October 19
Eurocurrency - October 17
Eurocurrency - October 13
Eurocurrency - October 11
Eurocurrency - October 6
Eurocurrency - October 3
Eurocurrency - September 26
Eurocurrency - September 23
Eurocurrency - September 16
Eurocurrency - September 14
Eurocurrency - September 12
Eurocurrency - September 9
Eurocurrency - September 7
Eurocurrency - September 6
Eurocurrency - September 2
Eurocurrency - August 30
Eurocurrency - August 18
Eurocurrency Boxes - August 12
Eurocurrency Boxes - August 3
Why 125-126 - July 27
Eurocurrency - July 26
Eurocurrency - July 25
Eurocurrency - July 22
Eurocurrency - July 21
Eurocurrency - July 19
Eurocurrency - July 15
Eurocurrency - July 14
Eurocurrency - July 13
Daily Eurocurrency Boxes - July 7
Eurocurrency - July 4
Eurocurrency - July 1
Eurocurrency - June 29
Eurocurrency - June 23
Eurocurrency - June 22
Eurocurrency Boxes - June 21
Hourly Eurocurrency Boxes - June 10
Eurocurrency Update - June 6
Eurocurrency Will Rally - June 1
Eurocurrency Boxes - May 25
Long Term Dollar Boxes (chart) - May 18
Short Term Dollar Boxes (chart) - May 18
Short Term Dollar Outlook - May 18
Long Term Value for US Dollar (chart) - May 15
Long Term Outlook for US Dollar - May 15
Dollar Chart 3 - May 14
Dollar Chart 2 - May 14
Dollar Chart 1 - May 14
Mirror Images of the US Dollar - May 14
Yikes ! - April 22
The New York Times and the US Dollar - April 21
POSTS IN 2008
Dollar Bull Market Underway - August 11
POSTS IN 2007
US Dollar - December 3
US Dollar - November 7
US Dollar Index - August 16
US Dollar and US Assets - May 22
POSTS IN 2006
The New York Times - Bearish to the Bone - December 6
The US Dollar - December 4
A Note on the Yen - November 7
Euro-USD and USD-Yen - September 28
USD \ Euro - July 27
US Dollar and the New York Times - July 18
Euro-Dollar - June 30
Dollar-Yen - June 30
Euro-USD and USD-Yen - June 29
Euro-USD - June 28
Yen and Euro - June 12
Us Dollar - June 6
US Dollar - May 22
Euro-US Dollar - May 17
Dollar Yen - May 15
Euro-USD - May 10
Dollar-Yen - April 27
Euro USD - April 27
Euro USD - April 7
US Dollar Index - April 4
US Dollar / Euro - April 3
US Dollar / Euro - March 28
US Dollar / Euro - March 23
US Dollar / Euro - March 21
US Dollar / Euro - March 16
Cash USD - euro - March 14
US Dollar/Euro - March 6
USD/Euro - February 24
Cash Euro-USD - February 10
Eurocurrency - February 8
US Dollar - January 30
US Dollar - January 26
Eurocurrency - January 23
US Dollar - January 18
Eurocurrency - January 18
US Dollar and the Eurocurrency - January 11
US Dollar Index - January 5
Eurocurrency - January 5
POSTS IN 2005
US Dollar - December 22
Eurocurrency - December 22
US Dollar - December 21
Eurocurrency - December 21
US Dollar - December 20
Eurocurrency - December 20
US Dollar Index - December 15
Eurocurrency - December 15
Eurocurrency - December 13
US Dollar - December 13
US Dollar Index - December 12
Eurocurrency - November 30
Eurocurrency - November 28
Eurocurrency - November 22
Eurocurrency - November 15
Eurocurrency - November 8
Eurocurrency - November 4
Eurocurrency - November 2
Eurocurrency - October 26
Eurocurrency - October 19
Eurocurrency - October 17
Eurocurrency - October 13
Eurocurrency - October 11
Eurocurrency - October 6
Eurocurrency - October 3
Eurocurrency - September 26
Eurocurrency - September 23
Eurocurrency - September 16
Eurocurrency - September 14
Eurocurrency - September 12
Eurocurrency - September 9
Eurocurrency - September 7
Eurocurrency - September 6
Eurocurrency - September 2
Eurocurrency - August 30
Eurocurrency - August 18
Eurocurrency Boxes - August 12
Eurocurrency Boxes - August 3
Why 125-126 - July 27
Eurocurrency - July 26
Eurocurrency - July 25
Eurocurrency - July 22
Eurocurrency - July 21
Eurocurrency - July 19
Eurocurrency - July 15
Eurocurrency - July 14
Eurocurrency - July 13
Daily Eurocurrency Boxes - July 7
Eurocurrency - July 4
Eurocurrency - July 1
Eurocurrency - June 29
Eurocurrency - June 23
Eurocurrency - June 22
Eurocurrency Boxes - June 21
Hourly Eurocurrency Boxes - June 10
Eurocurrency Update - June 6
Eurocurrency Will Rally - June 1
Eurocurrency Boxes - May 25
Long Term Dollar Boxes (chart) - May 18
Short Term Dollar Boxes (chart) - May 18
Short Term Dollar Outlook - May 18
Long Term Value for US Dollar (chart) - May 15
Long Term Outlook for US Dollar - May 15
Dollar Chart 3 - May 14
Dollar Chart 2 - May 14
Dollar Chart 1 - May 14
Mirror Images of the US Dollar - May 14
Yikes ! - April 22
The New York Times and the US Dollar - April 21


Mirror Images of the US Dollar
In a recent posts (here and here) I explained some reasons why I am long term bullish on the US dollar. The three charts you see above will help me explain another reason for being bullish on the dollar.
As you probably know I am a big fan of the late George Lindsay. Lindsay said that the principal method he used to compile his extraordinary stock market forecasting record from 1953 through 1970 was the mirror image chart.
Now you have to remember that Lindsay started out as a graphic artist. His artistic sense led him to look at price charts with the eye of an artist. In particular he loved to find balance and symmetry. The common idea found in all his methods was the idea of a time symmetry around a central point. I've tried to illustrate one of his ideas, the foldback chart, in previous posts (here, here , here , and here). The idea behind a foldback chart is that price highs can be found equidistant in time from a central date, the foldback point. The same goes for lows.
The idea behind a mirror image chart is much less obvious and much more daring. As with the foldback chart, one first must identify a central date, the mirror date. Typically this is the date of a major high or low or of a test of that high or low. Then the mirror inmage chart predicts that each important price extreme after the mirror date will be the same number of days after the mirror date as an equally important extreme was before the mirror date. So far this is the same rule as in the foldback chart.
Now comes the surprise. If top occurs some number of days before the mirror date, the mirror chart predicts that a low (the mirror image of the correponding top!) will occur the same number of days after the mirror date. Similarly, a low some number of days before the mirror date predicts a top the same number of days after the mirror date.
Why should this ever work? Beats me. But one thing is for sure, once you have identified a mirror date the chart can continue making quite accurate predictions for years into the future. And remember, Lindsay himself credited his outstanding forecast record to mirror image charts.
The hard work in constructing a mirror image forecast always occurs when trying to locate a mirror date in a chart. Often I can' find any mirror date in which case I must turn to other methods. Once I have a candidate for a mirror date I check the accuracy of the first few forecasts. Typically it takes some time for the mirror forecasts to start affecting the market so it is not unusual for the first one or two forecasts to fail. But as soon as a chart's mirror forecasts start working I know I have a valuable guide to future market behavior.
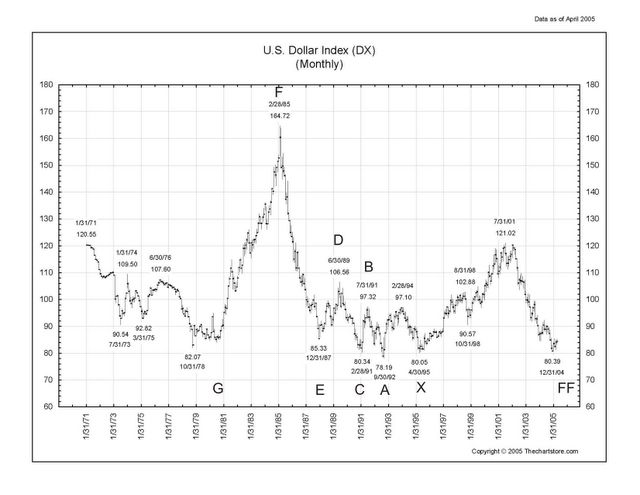
The charts ( 1, 2, 3 )you see above this post are monthly charts of the US Dollar index. The April 1995 low is labeled as point X. This is the mirror date I have chosen. The extremes before the mirror date are labeled with single capital letters: A, C, E, G are lows and B, D, F are highs. The corresponding predicted mirror extremes are labeled with the same letter doubled. For example, the low at C predicts a high at CC.
The first forecast of the mirror image chart was for a high at AA in November 1997. This was wrong. But the next forecast for a low BB in January 1999 was very accurate. The high at CC and the low at DD were similarly good forecasts. The forecast high at EE was a year late. The market had already dropped 10% by that time but would drop another 27% after point EE. Finally, the mirror chart predicted an extend drop from EE to FF in June 2005. I think the June 2005 prediction will turn out to be 6 months late, but again it was within 10% of the low.
What does the mirror chart predict now? An extended bull market in the dollar! The earliest date for the predicted dollar top is point GG (not shown on the chart) in January 2010. I expect the dollar to make it back to 121 during the next five years!
As you probably know I am a big fan of the late George Lindsay. Lindsay said that the principal method he used to compile his extraordinary stock market forecasting record from 1953 through 1970 was the mirror image chart.
Now you have to remember that Lindsay started out as a graphic artist. His artistic sense led him to look at price charts with the eye of an artist. In particular he loved to find balance and symmetry. The common idea found in all his methods was the idea of a time symmetry around a central point. I've tried to illustrate one of his ideas, the foldback chart, in previous posts (here, here , here , and here). The idea behind a foldback chart is that price highs can be found equidistant in time from a central date, the foldback point. The same goes for lows.
The idea behind a mirror image chart is much less obvious and much more daring. As with the foldback chart, one first must identify a central date, the mirror date. Typically this is the date of a major high or low or of a test of that high or low. Then the mirror inmage chart predicts that each important price extreme after the mirror date will be the same number of days after the mirror date as an equally important extreme was before the mirror date. So far this is the same rule as in the foldback chart.
Now comes the surprise. If top occurs some number of days before the mirror date, the mirror chart predicts that a low (the mirror image of the correponding top!) will occur the same number of days after the mirror date. Similarly, a low some number of days before the mirror date predicts a top the same number of days after the mirror date.
Why should this ever work? Beats me. But one thing is for sure, once you have identified a mirror date the chart can continue making quite accurate predictions for years into the future. And remember, Lindsay himself credited his outstanding forecast record to mirror image charts.
The hard work in constructing a mirror image forecast always occurs when trying to locate a mirror date in a chart. Often I can' find any mirror date in which case I must turn to other methods. Once I have a candidate for a mirror date I check the accuracy of the first few forecasts. Typically it takes some time for the mirror forecasts to start affecting the market so it is not unusual for the first one or two forecasts to fail. But as soon as a chart's mirror forecasts start working I know I have a valuable guide to future market behavior.
The charts ( 1, 2, 3 )you see above this post are monthly charts of the US Dollar index. The April 1995 low is labeled as point X. This is the mirror date I have chosen. The extremes before the mirror date are labeled with single capital letters: A, C, E, G are lows and B, D, F are highs. The corresponding predicted mirror extremes are labeled with the same letter doubled. For example, the low at C predicts a high at CC.
The first forecast of the mirror image chart was for a high at AA in November 1997. This was wrong. But the next forecast for a low BB in January 1999 was very accurate. The high at CC and the low at DD were similarly good forecasts. The forecast high at EE was a year late. The market had already dropped 10% by that time but would drop another 27% after point EE. Finally, the mirror chart predicted an extend drop from EE to FF in June 2005. I think the June 2005 prediction will turn out to be 6 months late, but again it was within 10% of the low.
What does the mirror chart predict now? An extended bull market in the dollar! The earliest date for the predicted dollar top is point GG (not shown on the chart) in January 2010. I expect the dollar to make it back to 121 during the next five years!
Thursday, May 12, 2005
S&P Boxes on May 12
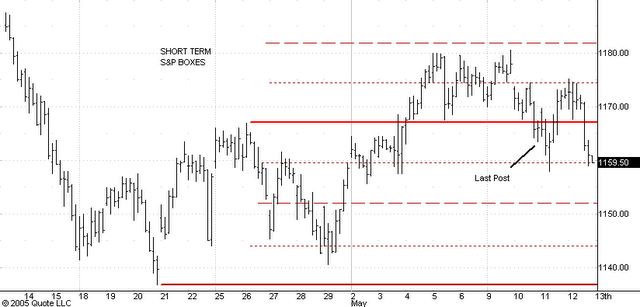
In my May 10 post on the S&P I said that the fact that the market had broken just below the 1167 top of the first box in an uptrend made it a buy near that level. (See black line pointing to the time and price of that post).
The market subsequently was weaker than I anticipated, dropping all the way to the 3/4 point of the first box, then rallying to the 1/4 of the second box. The fact that the market has again dropped below the top of the first box at 1167 means that it is probably headed down to the 1/2 point of the first box at 1152. I expect a rally to the top of the second box near 1197 from there.
The market subsequently was weaker than I anticipated, dropping all the way to the 3/4 point of the first box, then rallying to the 1/4 of the second box. The fact that the market has again dropped below the top of the first box at 1167 means that it is probably headed down to the 1/2 point of the first box at 1152. I expect a rally to the top of the second box near 1197 from there.
2005 Stock Market Forecast
THE U.S. STOCK MARKET IN 2005
December 31, 2004
I have made year-ahead stock market forecasts based on George Lindsay's methods twice before, the first time on January 2, 2003 and then again on January 5, 2004. To put my 2005 forecast in perspective I first quote from the summaries of the 2003 and 2004 forecasts.
From the January 2, 2003 forecast:
"The 20 year cycle and Lindsay's 12 and 15 year periods all suggest that a bear market low occurred in 2002 and that a bull market top is due possibly as early as late 2004 but more likely sometime in 2005.
"The drop from the market's December 2002 top will probably end at a low above the October 2002 low and terminate the basic decline which began from the march 18, 2002 top. Counting forward a long basic advance of 26 to 32 months from the upcoming secondary low also projects a bull market top for 2005. Finally, I suspect that the first stage of this bull market will take the form of Lindsay's three peaks and a domed house formation."
From the March 21, 2003 update to this forecast:
" [the] low established on March 12 [2003] ended the drop from the 954 top [of December 2002]. Counting forward 26 to 32 months (a long or extended basic advance) from March 12 we find a bull market high likely sometime between May and November 2005...If this foldback pattern continues to develop the market should now rally to the level of the top of the big rally which preceeded the drop into the July, 2002 low. This is the 1178 level. After 1178 is reached [in late 2003 or in 2004] the foldback pattern would then call for a drop to the 940 level (2004?) and then a rally to 1320 (mid 2005)."
From the January 5, 2004 forecast:
"These calculations all point to the same general conclusion. The first half of 2004 should be bullish although not as strong as the last 9 months of 2003. A good part of the year's first 9 months will probably be spent in an 80 point trading range [in the S&P]. A top should develop around 1178 and be followed by a substantial break of 120-180 S&P points and this break will probably end in the fall of 2004. After that low a fast advance lasting 7 to 8 months should culminate at the peak of the domed house and a bull market top around 1340 in 2005."
What can Lindsay's methods tell us about 2005?
First let's consider the 20 year cycle and Lindsay's long term time periods. The years 1985, 1965, 1945, 1925 and 1905 were all bullish years for U.S. stocks. Lindsay's 15 year 3 month period from bear market lows to bull market highs reinforces this 20 year cycle, bullish prognosis. Adding 15 years 3 months to the October 1990 low predicts a bull market top for January 31, 2006. Moreover, adding 12 years 10 months (Lindsay's time period from bull market tops to bear market lows) to the January 31, 1994 top (which started a year long sideway's period) predicts a bear market low for December 1, 2006. The predicted 10 month interval from 2006 high to 2006 low is the length of one of Lindsay's basic declines. This internal consistency reinforces our confidence in the forecast of a bullish 2005.
The next step in Lindsay's forecast technique is to consider the status of the market in terms of his theory of basic advances. These are time intervals, measured in calendar days, which typically start at bear market lows or at secondary lows near the bear market low and end at or very near the subsequent bull market top. In my 2003 and 2004 forecasts I noted that the 1998-2000 basic advance was abnormally short. Lindsay's theory of alternation would therefore lead me to expect an abnormally long basic advance for the 2002- 2005 bull market. After analyzing the basic declines during the 2000-2002 bear market I concluded that the March 12, 2003 secondary low probably marked the start of a long or extended basic advance. This in turn implies that a bull market top should probably develop sometime between May and November of 2005.
The fact that Lindsay's theory of basic advances predicts a bull market top before his long term time periods do also has some implications. Lindsay often observed that when these two forecast methods are out of sync by a few months the market does its best to make both "come true" for all practical purposes. In this instance I would therefore expect either a top very near the average forecast date (i.e. around September- October 2005) or alternately (see below) a top in July followed by a sideways trading range that terminate in January 2006. In either case 2006 should be a bearish year.
At this juncture we also have two additional pieces of information that were not available a year ago.
In the previous two annual forecasts I said that I expected a Lindsay "three peaks and a domed house" formation to develop during the 2002-2005 bull market. Just such a pattern developed in the Dow Industrials during 2004. The three peaks came in February, June and September and spanned a 7 month interval. This compares favorably with the 6 to 10 month interval Lindsay observed for major examples of this 3P-DH pattern. The subsequent separating decline in the Dow ended on October 25 at 9708. I interpret the December 9 low as Lindsay's base point for measuring forward in time. To this date we add 7 months 10 days to predict July 19, 2005 for the top of the domed house rally and the end of the bull market. Lindsay also observed that after the domed house is completed the subsequent bear market returns at least to the price level at which the three peaks formation began. This in my interpretation is the 958 low of August 2003. Thus 958 is a reasonable target for the bear market low expected late in 2006.
The second piece of information is the development during 2004 of what Lindsay called the "middle section" of the basic advance. In this case it is a declining middle section and lasted from February to October in the Dow and from March to August in the S&P. I shall use the Dow to make my projections to maintain consistency with the 3P-DH analysis above.
Lindsay's "count from the middle section" is a long term tool and in principle can be used only to predict the timing of the next bear market low and of the subsequent bull market high. However, Lindsay himself often described the process of forecasting as similar to the process of assembling a jig-saw puzzle. All of the pieces (forecasts derived from various techniques: long term time periods, basic advances and declines, 3P-DH and counts from the middle section) have to fit together smoothly. This requirement makes the entire Lindsay method much more effective than any one of its techniques used in isolation.
In this instance we know that Lindsay's other methods predict a bull market top for the second half of 2005 and a bear market low late in 2006. Moreover, counting 15 years three months from the March 1994 low brings us to June 2009 as a likely bull market top. Now we can attempt to count from 2004's middle section in the Dow. Lindsay's "point E" for this decending middle section is June 25, 2004 in our interpretation. The first consideration is that the time from this point E to the bull market top should equal the time from the bull market top to the next bear market low. At the moment my best estimate for this low comes from the 12 year 10 month time interval and is December 1, 2006. This is a little more than 29 months from point E and if the count from the middle section were to work exactly this would imply a bull market top 14 쩍 months after June 25, 2004, i.e. September 10, 2005.
Moroever, the duration of the subsequent bull market, in Lindsay's theory of the middle section, should equal the time from point E to the bear market low. My current estimate for this time interval (again based on the 12 year 10 month period) is 29 months and thus I would expect a bull market top in May 2009, almost exactly coincident with the implication of the 15 year 3 month period from low to high.
Let's now summarize the deductions I have drawn from Lindsay's timing methods. First, 2005 should be a generally bullish year. The bull market top could come as early as July 19, 2005 (3P-DH) or as late as January 31, 2006 (15 year 3 month period). My best guess is that in any case the market will trade essentially sideways after July 19, 2005 but that no really bad drop will occur until 2006 begins.
A bear market should be expected for 2006 with a low coming late in the year. The years 2007 and 2008 are expected to be bullish with a bull market top in 2009.
Where might the S&P stand at these highs and lows? Here Lindsay's timing methods are silent but I can make some deductions based on historical averages.
The 2000-2002 bear market dropped the S&P 50%. The last bear market of comparable magnitude was the 1973-1974 bear market. The subsequent 1974-1976 bull market sent prices up 77%. A comparable advance from the 2002 low of 768 predicts a 2005 top at 1350. The 1976-78 bear market dropped prices 28%. A similar drop from a 2005 top at 1350 would give a low in 2006 around 980. This should be compared with the 958 forecast for that low derived from the 3P-DH formation. The 1978-1980 bull market moved the S&P up to 225% of its 1974 low. A repeat performance for the 2007-2009 bull market would predict a top for the S&P in 2009 at 1730.
For those interested in learning more about Lindsay's methods we suggest the booklet "Selected Articles by the late George Lindsay" which is published by Investors Intelligence in New Rochelle, New York.
Carl Futia
Copyright 2004.
December 31, 2004
I have made year-ahead stock market forecasts based on George Lindsay's methods twice before, the first time on January 2, 2003 and then again on January 5, 2004. To put my 2005 forecast in perspective I first quote from the summaries of the 2003 and 2004 forecasts.
From the January 2, 2003 forecast:
"The 20 year cycle and Lindsay's 12 and 15 year periods all suggest that a bear market low occurred in 2002 and that a bull market top is due possibly as early as late 2004 but more likely sometime in 2005.
"The drop from the market's December 2002 top will probably end at a low above the October 2002 low and terminate the basic decline which began from the march 18, 2002 top. Counting forward a long basic advance of 26 to 32 months from the upcoming secondary low also projects a bull market top for 2005. Finally, I suspect that the first stage of this bull market will take the form of Lindsay's three peaks and a domed house formation."
From the March 21, 2003 update to this forecast:
" [the] low established on March 12 [2003] ended the drop from the 954 top [of December 2002]. Counting forward 26 to 32 months (a long or extended basic advance) from March 12 we find a bull market high likely sometime between May and November 2005...If this foldback pattern continues to develop the market should now rally to the level of the top of the big rally which preceeded the drop into the July, 2002 low. This is the 1178 level. After 1178 is reached [in late 2003 or in 2004] the foldback pattern would then call for a drop to the 940 level (2004?) and then a rally to 1320 (mid 2005)."
From the January 5, 2004 forecast:
"These calculations all point to the same general conclusion. The first half of 2004 should be bullish although not as strong as the last 9 months of 2003. A good part of the year's first 9 months will probably be spent in an 80 point trading range [in the S&P]. A top should develop around 1178 and be followed by a substantial break of 120-180 S&P points and this break will probably end in the fall of 2004. After that low a fast advance lasting 7 to 8 months should culminate at the peak of the domed house and a bull market top around 1340 in 2005."
What can Lindsay's methods tell us about 2005?
First let's consider the 20 year cycle and Lindsay's long term time periods. The years 1985, 1965, 1945, 1925 and 1905 were all bullish years for U.S. stocks. Lindsay's 15 year 3 month period from bear market lows to bull market highs reinforces this 20 year cycle, bullish prognosis. Adding 15 years 3 months to the October 1990 low predicts a bull market top for January 31, 2006. Moreover, adding 12 years 10 months (Lindsay's time period from bull market tops to bear market lows) to the January 31, 1994 top (which started a year long sideway's period) predicts a bear market low for December 1, 2006. The predicted 10 month interval from 2006 high to 2006 low is the length of one of Lindsay's basic declines. This internal consistency reinforces our confidence in the forecast of a bullish 2005.
The next step in Lindsay's forecast technique is to consider the status of the market in terms of his theory of basic advances. These are time intervals, measured in calendar days, which typically start at bear market lows or at secondary lows near the bear market low and end at or very near the subsequent bull market top. In my 2003 and 2004 forecasts I noted that the 1998-2000 basic advance was abnormally short. Lindsay's theory of alternation would therefore lead me to expect an abnormally long basic advance for the 2002- 2005 bull market. After analyzing the basic declines during the 2000-2002 bear market I concluded that the March 12, 2003 secondary low probably marked the start of a long or extended basic advance. This in turn implies that a bull market top should probably develop sometime between May and November of 2005.
The fact that Lindsay's theory of basic advances predicts a bull market top before his long term time periods do also has some implications. Lindsay often observed that when these two forecast methods are out of sync by a few months the market does its best to make both "come true" for all practical purposes. In this instance I would therefore expect either a top very near the average forecast date (i.e. around September- October 2005) or alternately (see below) a top in July followed by a sideways trading range that terminate in January 2006. In either case 2006 should be a bearish year.
At this juncture we also have two additional pieces of information that were not available a year ago.
In the previous two annual forecasts I said that I expected a Lindsay "three peaks and a domed house" formation to develop during the 2002-2005 bull market. Just such a pattern developed in the Dow Industrials during 2004. The three peaks came in February, June and September and spanned a 7 month interval. This compares favorably with the 6 to 10 month interval Lindsay observed for major examples of this 3P-DH pattern. The subsequent separating decline in the Dow ended on October 25 at 9708. I interpret the December 9 low as Lindsay's base point for measuring forward in time. To this date we add 7 months 10 days to predict July 19, 2005 for the top of the domed house rally and the end of the bull market. Lindsay also observed that after the domed house is completed the subsequent bear market returns at least to the price level at which the three peaks formation began. This in my interpretation is the 958 low of August 2003. Thus 958 is a reasonable target for the bear market low expected late in 2006.
The second piece of information is the development during 2004 of what Lindsay called the "middle section" of the basic advance. In this case it is a declining middle section and lasted from February to October in the Dow and from March to August in the S&P. I shall use the Dow to make my projections to maintain consistency with the 3P-DH analysis above.
Lindsay's "count from the middle section" is a long term tool and in principle can be used only to predict the timing of the next bear market low and of the subsequent bull market high. However, Lindsay himself often described the process of forecasting as similar to the process of assembling a jig-saw puzzle. All of the pieces (forecasts derived from various techniques: long term time periods, basic advances and declines, 3P-DH and counts from the middle section) have to fit together smoothly. This requirement makes the entire Lindsay method much more effective than any one of its techniques used in isolation.
In this instance we know that Lindsay's other methods predict a bull market top for the second half of 2005 and a bear market low late in 2006. Moreover, counting 15 years three months from the March 1994 low brings us to June 2009 as a likely bull market top. Now we can attempt to count from 2004's middle section in the Dow. Lindsay's "point E" for this decending middle section is June 25, 2004 in our interpretation. The first consideration is that the time from this point E to the bull market top should equal the time from the bull market top to the next bear market low. At the moment my best estimate for this low comes from the 12 year 10 month time interval and is December 1, 2006. This is a little more than 29 months from point E and if the count from the middle section were to work exactly this would imply a bull market top 14 쩍 months after June 25, 2004, i.e. September 10, 2005.
Moroever, the duration of the subsequent bull market, in Lindsay's theory of the middle section, should equal the time from point E to the bear market low. My current estimate for this time interval (again based on the 12 year 10 month period) is 29 months and thus I would expect a bull market top in May 2009, almost exactly coincident with the implication of the 15 year 3 month period from low to high.
Let's now summarize the deductions I have drawn from Lindsay's timing methods. First, 2005 should be a generally bullish year. The bull market top could come as early as July 19, 2005 (3P-DH) or as late as January 31, 2006 (15 year 3 month period). My best guess is that in any case the market will trade essentially sideways after July 19, 2005 but that no really bad drop will occur until 2006 begins.
A bear market should be expected for 2006 with a low coming late in the year. The years 2007 and 2008 are expected to be bullish with a bull market top in 2009.
Where might the S&P stand at these highs and lows? Here Lindsay's timing methods are silent but I can make some deductions based on historical averages.
The 2000-2002 bear market dropped the S&P 50%. The last bear market of comparable magnitude was the 1973-1974 bear market. The subsequent 1974-1976 bull market sent prices up 77%. A comparable advance from the 2002 low of 768 predicts a 2005 top at 1350. The 1976-78 bear market dropped prices 28%. A similar drop from a 2005 top at 1350 would give a low in 2006 around 980. This should be compared with the 958 forecast for that low derived from the 3P-DH formation. The 1978-1980 bull market moved the S&P up to 225% of its 1974 low. A repeat performance for the 2007-2009 bull market would predict a top for the S&P in 2009 at 1730.
For those interested in learning more about Lindsay's methods we suggest the booklet "Selected Articles by the late George Lindsay" which is published by Investors Intelligence in New Rochelle, New York.
Carl Futia
Copyright 2004.
2004 Stock Market Forecast
THE U.S STOCK MARKET IN 2004
January 2, 2004
Our last long term stock market forecast was published on January 2, 2003 and updated on March 21, 2003. The January forecast predicted that the October 2002 low at 768 would prove to be the lowest level the S&P would reach until at least the end of 2005. Moreover, we asserted that the market drop which had begun in the S&P 500 from 953 on December 2, 2002 would end at a low above the 768 low and that this higher low would occur some time in the January- February time frame.
On March 21 we identified the March 12 low at 788 as the low of that decline and predicted that the advance that had just begun would carry the S&P to 1178 before a reaction of 10% or more would occur. This price target was based upon what we thought was a likely symmetry or fold-back pattern in the S&P. If this pattern were to continue it would imply a rally to the March 2002 top at 1178, a subsequent drop to the September 2001 low at 944 and then a rally above the 1300 level.
So far the stock market appears to be following this script pretty well and until a big deviation becomes obvious there is little reason to alter our general expectation. Our best guess is that the S&P will trade in the 1000-1200 range during 2004. Moreover, the first half of the year should continue the bullish tendency of 2003 while the second half of 2004 should see a drop in this average of 10-15%.
This estimate of the S&P's likely pattern in 2004 is based in part on our interpretation of George Lindsay's stock market prediction methods. In our January 2003 forecast we explained why these methods pointed to an ongoing bull market which would continue well into 2005.
The general timing of the expected bull market top in 2005 was suggested by Lindsay's long time period of 15 years 3 months from low to high which predicts a top in January 2006 if started from the October 1990 low. Lindsay's 28 year time period from high to high would suggest a top in September 2004 if started from the September 1976 top. The 20, 40 and 60 year cycles all suggest that 2004 and 2005 will be bullish years on average while the average of these cycles predicts a big break in 2006. Moreover, this general picture is consistent with the 4 year cycle in stock prices which has been very dominant since 1950 and last bottomed in 2002.
The Mach 12, 2003 low ended one of Lindsay's basic declines, as did the September 21, 2001 low. In each of these cases the preceeding basic advance had been subnormal in duration and when this happens Lindsay's rule is to expect the subsequent basic advance to last anywhere from 26 to 32 months. The September 21, 2001 low thus leads us to expect some sort of visible top in the November 2003 to May 2004 time frame. The fold-back pattern predicts this high around 1178. However, this is too early for the bull market top and so we would expect only a drop to 10-15% in the averages before a move to new highs for the move up from 768 begins.
The basic advance from the March 2003 low is projected to end in the May 2005 to November 2005 time frame. This is likely to be the bull market top and should occur somewhere above 1300 based upon the fold back pattern. We might add that Lindsay put significant weight on the Jupiter-Saturn synodic cycle of about 20 years. This cycle called for a big top in May 2000 and another top in December 2005.
Lindsay observed that the U.S. stock market tended to follow what he called a "Three Peaks and a Domed House" formation roughly 60 % of the time from the mid-1800's until the present. This pattern typically lasts about 20 months from the date of the first peak until the top of the domed house which usually ends a bull market. The three peaks typically occur at about the same level (although there are substantial variations here) and mark the end of the first advancing phase of the bull market. About 7 to 9 months typically separates the the first peak from the third. Our guess is that a three peaks pattern has already started to develop (in which case the first peak occurred on September 19, 2003 at 1039) or will soon do so. This would suggest that no significant break will start until at least 7 months has elapsed from the first peak. Thus April 2004 is the earliest we would expect the market to be vulnerable to a drop of 10% or more. It is interesting to compare this with the basic advance fromm the September 2001 low which projects some sort of top in the November 2003-May 2004 time frame.
If a three peaks-domed house indeed started in September 2003 then the peak of the domed house and the end of the bull market becomes likely about 20 months later, i.e. in May 2005.
These calculations all point to the same general conclusion. The first half of 2004 should be bullish although not as strong as the last 9 months of 2003. A good part of the year's first 9 months will probably be spent in an 80 point trading range. A top should develop around 1178 and be followed by a substantial break of 120-180 S&P points and this break will probably end in the fall of 2004. After that low a fast advance lasting 7 to 8 months should culminate at the peak of the domed house and a bull market top around 1340 in 2005.
Carl Futia
Copyright 2004
January 2, 2004
Our last long term stock market forecast was published on January 2, 2003 and updated on March 21, 2003. The January forecast predicted that the October 2002 low at 768 would prove to be the lowest level the S&P would reach until at least the end of 2005. Moreover, we asserted that the market drop which had begun in the S&P 500 from 953 on December 2, 2002 would end at a low above the 768 low and that this higher low would occur some time in the January- February time frame.
On March 21 we identified the March 12 low at 788 as the low of that decline and predicted that the advance that had just begun would carry the S&P to 1178 before a reaction of 10% or more would occur. This price target was based upon what we thought was a likely symmetry or fold-back pattern in the S&P. If this pattern were to continue it would imply a rally to the March 2002 top at 1178, a subsequent drop to the September 2001 low at 944 and then a rally above the 1300 level.
So far the stock market appears to be following this script pretty well and until a big deviation becomes obvious there is little reason to alter our general expectation. Our best guess is that the S&P will trade in the 1000-1200 range during 2004. Moreover, the first half of the year should continue the bullish tendency of 2003 while the second half of 2004 should see a drop in this average of 10-15%.
This estimate of the S&P's likely pattern in 2004 is based in part on our interpretation of George Lindsay's stock market prediction methods. In our January 2003 forecast we explained why these methods pointed to an ongoing bull market which would continue well into 2005.
The general timing of the expected bull market top in 2005 was suggested by Lindsay's long time period of 15 years 3 months from low to high which predicts a top in January 2006 if started from the October 1990 low. Lindsay's 28 year time period from high to high would suggest a top in September 2004 if started from the September 1976 top. The 20, 40 and 60 year cycles all suggest that 2004 and 2005 will be bullish years on average while the average of these cycles predicts a big break in 2006. Moreover, this general picture is consistent with the 4 year cycle in stock prices which has been very dominant since 1950 and last bottomed in 2002.
The Mach 12, 2003 low ended one of Lindsay's basic declines, as did the September 21, 2001 low. In each of these cases the preceeding basic advance had been subnormal in duration and when this happens Lindsay's rule is to expect the subsequent basic advance to last anywhere from 26 to 32 months. The September 21, 2001 low thus leads us to expect some sort of visible top in the November 2003 to May 2004 time frame. The fold-back pattern predicts this high around 1178. However, this is too early for the bull market top and so we would expect only a drop to 10-15% in the averages before a move to new highs for the move up from 768 begins.
The basic advance from the March 2003 low is projected to end in the May 2005 to November 2005 time frame. This is likely to be the bull market top and should occur somewhere above 1300 based upon the fold back pattern. We might add that Lindsay put significant weight on the Jupiter-Saturn synodic cycle of about 20 years. This cycle called for a big top in May 2000 and another top in December 2005.
Lindsay observed that the U.S. stock market tended to follow what he called a "Three Peaks and a Domed House" formation roughly 60 % of the time from the mid-1800's until the present. This pattern typically lasts about 20 months from the date of the first peak until the top of the domed house which usually ends a bull market. The three peaks typically occur at about the same level (although there are substantial variations here) and mark the end of the first advancing phase of the bull market. About 7 to 9 months typically separates the the first peak from the third. Our guess is that a three peaks pattern has already started to develop (in which case the first peak occurred on September 19, 2003 at 1039) or will soon do so. This would suggest that no significant break will start until at least 7 months has elapsed from the first peak. Thus April 2004 is the earliest we would expect the market to be vulnerable to a drop of 10% or more. It is interesting to compare this with the basic advance fromm the September 2001 low which projects some sort of top in the November 2003-May 2004 time frame.
If a three peaks-domed house indeed started in September 2003 then the peak of the domed house and the end of the bull market becomes likely about 20 months later, i.e. in May 2005.
These calculations all point to the same general conclusion. The first half of 2004 should be bullish although not as strong as the last 9 months of 2003. A good part of the year's first 9 months will probably be spent in an 80 point trading range. A top should develop around 1178 and be followed by a substantial break of 120-180 S&P points and this break will probably end in the fall of 2004. After that low a fast advance lasting 7 to 8 months should culminate at the peak of the domed house and a bull market top around 1340 in 2005.
Carl Futia
Copyright 2004
2003 Stock Market Forecast
January 2, 2003
The analytical methods of the late George Lindsay often offer unique insights into the probable course of the stock market averages in the U.S. The advent of this new year offers a particularly interesting juncture at which I believe they have something very important to say.
Anyone with an interest in learning about George Lindsay's stock market methods would do well to obtain a copy of a booklet entitled "Selected Articles by the late George Lindsay". It is available for a modest price from Investor???s Intelligence in New Rochelle, NY (Tel: 914 632 0422 ) (usinfo@investorsintelligence.com).
The methods used in the analysis below are those which Lindsay referred to as his long time intervals of 15 and 12 years and the method of basic advances and declines. Both of these are described in his article "Counts from the Middle Section" in the booklet cited above. Additional details on these methods can also be found in the article "Interpreting the Stock Market Day-by Day" in the same booklet.
I shall not have much to say about Lindsay's other two, long term forcasting techniques: the three peaks and domed house formation and the method of counts from the middle section. At the current time neither one has much to say about the current market situation, but both can be very valuable in the appropriate context.
THE 20 YEAR CYCLE
In my last conversation with Lindsay back in 1981 he told me that his forecasts were based 95% on his methods for counting time. Lindsay regarded the 20 year cycle in stock prices a very important one.
In August of 1982 the US stock market established an important low and the great stock market boom of the next 18 years began. Counting forward 20 years we arrive at August 2002, suggesting that a major low was due then. The year 1983 was a generally bullish year for stocks and so the 20 year cycle suggests that 2003 will be bullish also.
In June and October 1962 the Dow established important lows from which a 3 -year bull market began. Thus the 40 year cycle suggest a low in 2002 and a bullish year in 2003.
Finally, the Dow ended a 5 year bear market in April 1942 and then began a 4 year bull market. Counting forward 60 years one would expect a low in 2002 with a new bull market beginning from that low.
LINDSAY'S LONG TIME PERIODS
The cornerstone of Lindsay's long term forecasts were his long time periods of 15 and 12 years.
Lindsay had observed that counting forward an average of 12 years and 6 months from important bull market tops often comes very close in time to a bear market low or to an important secondary low close to the level of the bear market low.
Lindsay also observed that couning forward an average of 15 years and 6 months from a bear market low often comes very close in time to a bull market top or to a secondary top at nearly the same price level as the bull market top.
Lindsay placed special emphasis on those situations in which one can start counting a 12 year period from the end of a 15 year period "that worked" and vice versa. In other words, he believed that there was a 28 year period from high to high and low to low.
There was a very important bear market low in October 1974 (S&P 500) and December 1974 (Dow). Couning forward 15 years and 6 months we arrive at March-May 1990. A bull market top occurred in July, 1990 and was followed by a brief bear market that dropped the averages 20% and heralded the 1990-1991 recession. Counting forward 12 years and 6 months from the July 1990 we arrive at January 2003 as a time for a bear market low. Counting forward 28 years from the 1974 low we arrive at the Ocober-December 2002 period as the ideal time for such a low.
Linday's long time periods clearly forecast a bear market low late in 2002 or early in 2003.
Do these long periods tell us anything about the timing of the next bull market top? Counting forward 15 years and 6 months from the October 1990 low we arrive at April 2006 as at projected bull market top. On the other hand, from the bull market top in September 1976 we can count forward 28 years and find September 2004 as a date for the next bull market top. The former projection agrees better with the 20 year cycle and planetary periods discussed above. The latter projection agrees better with the mechanical 4 year cycle projection. However, the best way to resolve a conflict such as this is to check these projections against the implications of Lindsay's method of basic advances and declines.
BASIC ADVANCES AND DECLINES
Lindsay observed that there was a remarkable consistency in the time, measured in calenday days, that it took bull and bear trends in the averages to move from high to low or low to high. His theory of these so-called basic advances and declines is explained in the articles cited above.
The 2000-2002 bear market was unusual in that it consisted of two basic declines, back to back. The typical basic decline lasts anywhere from 8 to 15 months (Lindsay classifies them into three types: subnormal - about 8 months, normal- about 11 months, and long about 14 months). Lindsay's rule was that once a basic decline ended a basic advance had to begin. In a situation like the 2000-2002 bear market, the market will make a lower low during the course of the basic advance which begins after the bear market's first basic decline has ended.
The first basic decline of the 2000- 2002 bear market began on September 1, 2000 and ended on September 21, 2001, lasting 385 days. Lindsay would have begun this decline from the lower top in September 2000 instead of the bull market top in January or March of that year because the market's action for the first 8 months of 2000 was an extended sideways period ending at what Lindsay calls a "right shoulder". The right shoulder is the preferred starting point for counting a basic decline.
The 385 day length of the first basic decline classifies it as a "long" basic decline. A basic advance started on September 21, 2001. Since the basic advance which ended the 1998-2000 bull market was of subnormal length in Lindsay's classification, the subsequent basic advance should be expected to be long (about 26 months) or extended (about 32 months). In this case a 26 month basic advance would end in November 2003, coincident with minor synodic cycles cited above. This suggests that the late 2003 turing point will be an intermediate term high point.
At this point we can entertain an interesting hypothesis. According to Lindsay, the stock market can usually be found in some stage of a 3 peaks and a domed house formation about 60% of the time. We speculate that the first stage of the upcoming bull market will take the form of the three peaks. If the first peak occurred on December 2, 2002, the third peak can be expected about 9-10 months later, in this case September-October 2003. From the third peak an intermediate term (10-15%) decline can be expected and from the subsequent low another strong advance (the domed house) to new highs for the bull market should develop.
Let us return to the analysis of basic declines and advances. After the first basic decline of the bear market ended on Sepember 21, 2001, the market rallied for about 6 months. A second basic decline began on March 19, 2002. The shortest possible basic decline should last no less than 231 days according to Lindsay and consequently the low in October 2002 cannot be the low of the basic decline. In this situation Lindsay would probably be looking for the basic decline to end at a secondary low, a low above the October low. Moreover, since the long time periods all point to a low late in 2002 or early in 2003 Lindsay would probably expect this basic decline to last either 294, 326 or 342 days. A 294 day basic decline would end on January 7, a 326 day decline on February 7 and a 342 day decline on February 25.
From the end of this basic decline a new basic advance should start. Again, the last basic advance ended the 1998-2000 bull market was subnormal in length. Therefore the basic advance which is likely to begin from the upcoming low should last somewhere between 26 and 32 months. This projects a bull market top sometime during 2005.
SUMMARY
The 20 year cycle and Lindsay's 12 and 15 year periods all suggest that a bear market low occurred in 2002 and that a bull market top is due possibly as early as late 2004 but more likely sometime in 2005.
The drop from the market's December 2002 top will probably end at a low above the October 2002 low and terminate the basic decline which began from the March 18, 2002 top. Counting forward a long basic advance of 26 to 32 months from the upcoming secondary low also projects a bull market top for 2005. Finally, we suspect that the first stage of this bull market will take the form of Lindsay"s three peaks and a domed house" formation.
Carl Futia
Copyright- 2003
The analytical methods of the late George Lindsay often offer unique insights into the probable course of the stock market averages in the U.S. The advent of this new year offers a particularly interesting juncture at which I believe they have something very important to say.
Anyone with an interest in learning about George Lindsay's stock market methods would do well to obtain a copy of a booklet entitled "Selected Articles by the late George Lindsay". It is available for a modest price from Investor???s Intelligence in New Rochelle, NY (Tel: 914 632 0422 ) (usinfo@investorsintelligence.com).
The methods used in the analysis below are those which Lindsay referred to as his long time intervals of 15 and 12 years and the method of basic advances and declines. Both of these are described in his article "Counts from the Middle Section" in the booklet cited above. Additional details on these methods can also be found in the article "Interpreting the Stock Market Day-by Day" in the same booklet.
I shall not have much to say about Lindsay's other two, long term forcasting techniques: the three peaks and domed house formation and the method of counts from the middle section. At the current time neither one has much to say about the current market situation, but both can be very valuable in the appropriate context.
THE 20 YEAR CYCLE
In my last conversation with Lindsay back in 1981 he told me that his forecasts were based 95% on his methods for counting time. Lindsay regarded the 20 year cycle in stock prices a very important one.
In August of 1982 the US stock market established an important low and the great stock market boom of the next 18 years began. Counting forward 20 years we arrive at August 2002, suggesting that a major low was due then. The year 1983 was a generally bullish year for stocks and so the 20 year cycle suggests that 2003 will be bullish also.
In June and October 1962 the Dow established important lows from which a 3 -year bull market began. Thus the 40 year cycle suggest a low in 2002 and a bullish year in 2003.
Finally, the Dow ended a 5 year bear market in April 1942 and then began a 4 year bull market. Counting forward 60 years one would expect a low in 2002 with a new bull market beginning from that low.
LINDSAY'S LONG TIME PERIODS
The cornerstone of Lindsay's long term forecasts were his long time periods of 15 and 12 years.
Lindsay had observed that counting forward an average of 12 years and 6 months from important bull market tops often comes very close in time to a bear market low or to an important secondary low close to the level of the bear market low.
Lindsay also observed that couning forward an average of 15 years and 6 months from a bear market low often comes very close in time to a bull market top or to a secondary top at nearly the same price level as the bull market top.
Lindsay placed special emphasis on those situations in which one can start counting a 12 year period from the end of a 15 year period "that worked" and vice versa. In other words, he believed that there was a 28 year period from high to high and low to low.
There was a very important bear market low in October 1974 (S&P 500) and December 1974 (Dow). Couning forward 15 years and 6 months we arrive at March-May 1990. A bull market top occurred in July, 1990 and was followed by a brief bear market that dropped the averages 20% and heralded the 1990-1991 recession. Counting forward 12 years and 6 months from the July 1990 we arrive at January 2003 as a time for a bear market low. Counting forward 28 years from the 1974 low we arrive at the Ocober-December 2002 period as the ideal time for such a low.
Linday's long time periods clearly forecast a bear market low late in 2002 or early in 2003.
Do these long periods tell us anything about the timing of the next bull market top? Counting forward 15 years and 6 months from the October 1990 low we arrive at April 2006 as at projected bull market top. On the other hand, from the bull market top in September 1976 we can count forward 28 years and find September 2004 as a date for the next bull market top. The former projection agrees better with the 20 year cycle and planetary periods discussed above. The latter projection agrees better with the mechanical 4 year cycle projection. However, the best way to resolve a conflict such as this is to check these projections against the implications of Lindsay's method of basic advances and declines.
BASIC ADVANCES AND DECLINES
Lindsay observed that there was a remarkable consistency in the time, measured in calenday days, that it took bull and bear trends in the averages to move from high to low or low to high. His theory of these so-called basic advances and declines is explained in the articles cited above.
The 2000-2002 bear market was unusual in that it consisted of two basic declines, back to back. The typical basic decline lasts anywhere from 8 to 15 months (Lindsay classifies them into three types: subnormal - about 8 months, normal- about 11 months, and long about 14 months). Lindsay's rule was that once a basic decline ended a basic advance had to begin. In a situation like the 2000-2002 bear market, the market will make a lower low during the course of the basic advance which begins after the bear market's first basic decline has ended.
The first basic decline of the 2000- 2002 bear market began on September 1, 2000 and ended on September 21, 2001, lasting 385 days. Lindsay would have begun this decline from the lower top in September 2000 instead of the bull market top in January or March of that year because the market's action for the first 8 months of 2000 was an extended sideways period ending at what Lindsay calls a "right shoulder". The right shoulder is the preferred starting point for counting a basic decline.
The 385 day length of the first basic decline classifies it as a "long" basic decline. A basic advance started on September 21, 2001. Since the basic advance which ended the 1998-2000 bull market was of subnormal length in Lindsay's classification, the subsequent basic advance should be expected to be long (about 26 months) or extended (about 32 months). In this case a 26 month basic advance would end in November 2003, coincident with minor synodic cycles cited above. This suggests that the late 2003 turing point will be an intermediate term high point.
At this point we can entertain an interesting hypothesis. According to Lindsay, the stock market can usually be found in some stage of a 3 peaks and a domed house formation about 60% of the time. We speculate that the first stage of the upcoming bull market will take the form of the three peaks. If the first peak occurred on December 2, 2002, the third peak can be expected about 9-10 months later, in this case September-October 2003. From the third peak an intermediate term (10-15%) decline can be expected and from the subsequent low another strong advance (the domed house) to new highs for the bull market should develop.
Let us return to the analysis of basic declines and advances. After the first basic decline of the bear market ended on Sepember 21, 2001, the market rallied for about 6 months. A second basic decline began on March 19, 2002. The shortest possible basic decline should last no less than 231 days according to Lindsay and consequently the low in October 2002 cannot be the low of the basic decline. In this situation Lindsay would probably be looking for the basic decline to end at a secondary low, a low above the October low. Moreover, since the long time periods all point to a low late in 2002 or early in 2003 Lindsay would probably expect this basic decline to last either 294, 326 or 342 days. A 294 day basic decline would end on January 7, a 326 day decline on February 7 and a 342 day decline on February 25.
From the end of this basic decline a new basic advance should start. Again, the last basic advance ended the 1998-2000 bull market was subnormal in length. Therefore the basic advance which is likely to begin from the upcoming low should last somewhere between 26 and 32 months. This projects a bull market top sometime during 2005.
SUMMARY
The 20 year cycle and Lindsay's 12 and 15 year periods all suggest that a bear market low occurred in 2002 and that a bull market top is due possibly as early as late 2004 but more likely sometime in 2005.
The drop from the market's December 2002 top will probably end at a low above the October 2002 low and terminate the basic decline which began from the March 18, 2002 top. Counting forward a long basic advance of 26 to 32 months from the upcoming secondary low also projects a bull market top for 2005. Finally, we suspect that the first stage of this bull market will take the form of Lindsay"s three peaks and a domed house" formation.
Carl Futia
Copyright- 2003
Year Ahead Forecasts
When I was in the newsletter business 25 years ago I used to publish year ahead forecasts for the stock and bond markets. Some were spectaculary good, others mediocre or worse.
I stopped publishing long range forecasts when I left the newsletter business in 1983. It didn't seem to me that such forecasts had much value when it came to short term speculation which was my interest at the time.
As the years passed I began to understand that the true situation was quite the reverse. Indeed, if your only interest is making money in the markets, then a reasonably accurate long term forecast is worth much more than its weight in gold! So starting in 2003 I began to send long term stock market forecasts to my market friends and in 2004 starting doing the same thing for the bond market.
These are the forecasts that are posted above.
I stopped publishing long range forecasts when I left the newsletter business in 1983. It didn't seem to me that such forecasts had much value when it came to short term speculation which was my interest at the time.
As the years passed I began to understand that the true situation was quite the reverse. Indeed, if your only interest is making money in the markets, then a reasonably accurate long term forecast is worth much more than its weight in gold! So starting in 2003 I began to send long term stock market forecasts to my market friends and in 2004 starting doing the same thing for the bond market.
These are the forecasts that are posted above.
Wednesday, May 11, 2005
It's NEVER Easy!
Every few days I read an article in the financial press telling me that the future direction of stock prices (or interest rates or the dollar or crude oil or gold or.......) is very uncertain. Usually the writer tries to tell me that this is an unusual situation. The typical excuse is that in these "unusual" times there are so many conflicting crosscurrents. The implication is that in "normal" times it is easy to guess what lies ahead of us in the future because most of the evidence will point one way or the other.
Let me tell you something. The future ALWAYS looks uncertain. To imagine it is ever otherwise is just plain dumb. Actually, there is a technical term for this sort of foolishness. It's called "hindsight bias". Hindsight bias is a particularly deadly disease when contracted by an amateur speculator.
You see, it always looks like it should have been easy to forecast past events. By the time history is written past events appear almost inevitable. We can always come up with good reasons why they happened. This process of explaining why past events happened I call "forecasting the past". You can read this sort of thing every day in the Wall Street Journal's daily stock market column.
Astologers, journalists and most market technicians like to forecast the past. Some are even good at it! Politicians often have some fun forecasting the past too. For example, they recently have been telling their constituents and the benighted intelligence community that it should have been obvious that Saddam Hussein had already destroyed his WMD and that any half-wit could have foreseen and detected the plans for the attacks upon the USA on 9/11.
Think about this for a second. If the future course of stock prices were obvious to most people, there would be no stock market! Why? Because if most people agreed that stock prices had to go up, who would be selling? A market requires a buyer for every seller!
An active and liquid market is absolutely rock-solid evidence that there is great uncertainty about the future and about its consequences for market prices. There has to be a lot of disagreement about the future in order to induce people to trade with one another!
The principal role of markets is to give anyone with capital and a stake in the future the opportunity to express his views by buying or selling. This process is called price discovery. The market always is looking for the price that will induce the most trading. And this is exactly the price that will induce the most uncertainty about future price trends!
So we must conclude that in any active and liquid market the future will always look very cloudy and uncertain to market participants. I have been forecasting stock prices for nearly forty years and don't remember a single day when future events seemed inevitable to me!
Uncertainty and confusion is the normal state of affairs in any active market. Dont' let anyone ever tell you otherwise.
Let me tell you something. The future ALWAYS looks uncertain. To imagine it is ever otherwise is just plain dumb. Actually, there is a technical term for this sort of foolishness. It's called "hindsight bias". Hindsight bias is a particularly deadly disease when contracted by an amateur speculator.
You see, it always looks like it should have been easy to forecast past events. By the time history is written past events appear almost inevitable. We can always come up with good reasons why they happened. This process of explaining why past events happened I call "forecasting the past". You can read this sort of thing every day in the Wall Street Journal's daily stock market column.
Astologers, journalists and most market technicians like to forecast the past. Some are even good at it! Politicians often have some fun forecasting the past too. For example, they recently have been telling their constituents and the benighted intelligence community that it should have been obvious that Saddam Hussein had already destroyed his WMD and that any half-wit could have foreseen and detected the plans for the attacks upon the USA on 9/11.
Think about this for a second. If the future course of stock prices were obvious to most people, there would be no stock market! Why? Because if most people agreed that stock prices had to go up, who would be selling? A market requires a buyer for every seller!
An active and liquid market is absolutely rock-solid evidence that there is great uncertainty about the future and about its consequences for market prices. There has to be a lot of disagreement about the future in order to induce people to trade with one another!
The principal role of markets is to give anyone with capital and a stake in the future the opportunity to express his views by buying or selling. This process is called price discovery. The market always is looking for the price that will induce the most trading. And this is exactly the price that will induce the most uncertainty about future price trends!
So we must conclude that in any active and liquid market the future will always look very cloudy and uncertain to market participants. I have been forecasting stock prices for nearly forty years and don't remember a single day when future events seemed inevitable to me!
Uncertainty and confusion is the normal state of affairs in any active market. Dont' let anyone ever tell you otherwise.
Subscribe to:
Posts (Atom)