Friday, May 12, 2006

S&P


Here is a 5 minute bar chart showing regular hours trading in the June S&P e-mini futures. I last commented on this chart yesterday.

I thought we would see a low around 1306 because at that level the drop from 1331 would have equalled the the preceeding reaction from 1324 to 1300. But no support materialized there so we have to look at previous reactions within the move up from the October 2005 low at 1172 to get some idea of where this reaction might stop.

In April the next biggest reaction dropped the S&P futures about 37 points from 1324 to 1286.50. The biggest reaction withink the entire uptrend from 1172 started from a top in 1301 early in January and ended near 1255 in February, a drop of 46 points.

A 37 point drop from 1331 would drop the market to 1294 while a 46 point drop would end near the low around 1286. At the moment I would have to prefer the 1286 taret because as yet I don't see a three stage correction from 1331 visible on the daily bar chart. So I would guess that the first phase would end near 1294, the second phase rally would bring the market back into the 1310-20 zone and the third phase would end near 1286.

As you can see on the chart above the pattern of lower lows and lower highs has yet to be broken. When it is we will have a sign that the second phase rally has begun.

Guesstimates on May 12, 8:50 am ET

June S&P Futures: The market has reached the 1306 support level at which point the drop from 1331 equals the length of the last reaction which had ended at 1300. I still think the market will make a low here.

June Bonds: The bonds broke well below support at 106-00 so the market will now drop to 104-20. Resistance above the market today is at 106-04.

June 10 Year Notes: The notes broke below 104-30 support today so I think the market will continue down to 104-04. Resistance above the market is at 105-04.

Euro-US Dollar: This market has been much stronger than I anticipated. This morning it moved a bit above the symmetry top of 129.27 seen in February 2005.  The subsequent action today indicated that the market is beginning a drop to short term support at 128.00. More weakness than that will have very bearish indications.

Dollar-Yen: The market has dropped a little below my 110.20 target. Even so I think the ground is being prepared for a big move up.

June Crude: The  upside target at the 74.30 level, the 7 5/8 multiple of the all time low at 9.75, has been reached and I think the market is on its way below $60.

June Gold: The market has reached the 725 target. My best guess is that 732 will hold for a few days and that a reaction to 700 will be the next development.  

July Silver: Silver is on its way to the 1600 level and meanwhile support stands at 1440.

Google: It looks like the third stage of the drop from 455 is underway and my downside target is 372. I still think GOOG will make it to 495.

Thursday, May 11, 2006

S&P Update


Here is a 5 minute bar chart showing regular hours trading in the June S&P e-mini futures. I commented on the 15 minute chart for this market earlier today.

As you can see the market traded sideways once it reached my estimated support at 1313, then broke visibly below support, and finally rallied back to this support which as is usual in such circumstances became resistance.

Note too how the sequence of rallies and declines which started from the 1330 top shows a steady pattern of lower lows and lower highs. The last rally was the biggest and longest of the rallies on the way down and this is one clue that the next rally will be bigger still and will probably start from the low of the reaction.

I still think the S&P futures will make a low above the 1300 level and if I am right about this then we should see this low around 1306.

Baidu


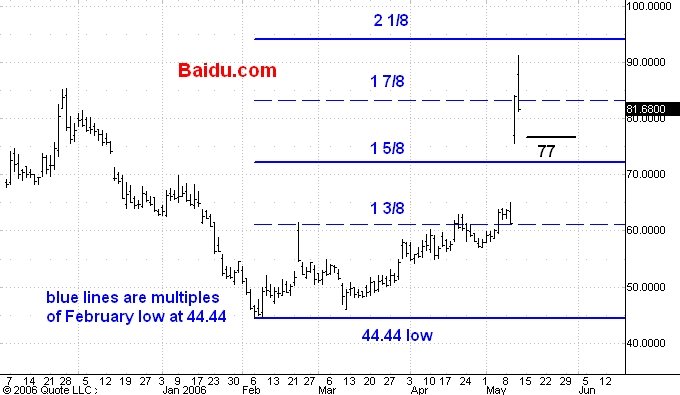
Here is a daily chart of Baidu.com, the Chinese version of Google. I last commented on BIDU here.

BIDU nearly reached my 93 target today and so far has dropped 10 points from the day's high. I think support stands at 77 and if the market shows a clear three phase reaction by the time it reaches 77 then a move up to 102 will probably start. If BIDU gets to 77 in only the first phase then I will look for a rally to a top below 91 and then a third stage drop to64 or so.

Google


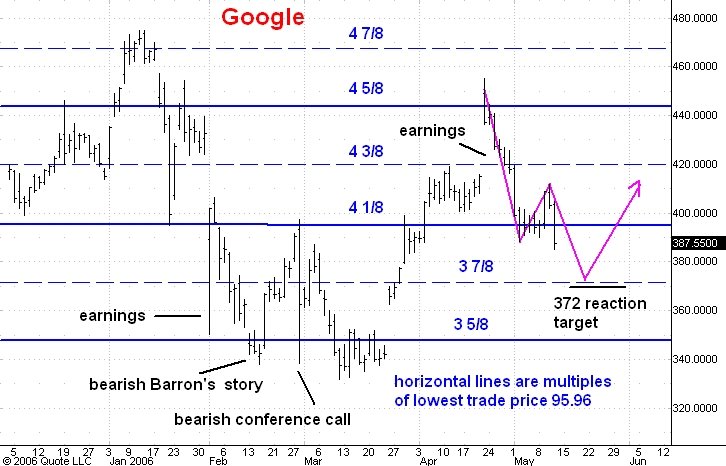
Here is a daily chart of Google. I last commented on GOOG here.

I thought that the second phase of the three phase reaction from 455 would carry at least to 420 but the market only made it to 412 or so. The third and final phase is underway and I expect it to stop at the 3 7/8 mutliple of the 96 all time low in GOOG near the 372 level. Once this reaction is complete I expect a move to 495.

Silver


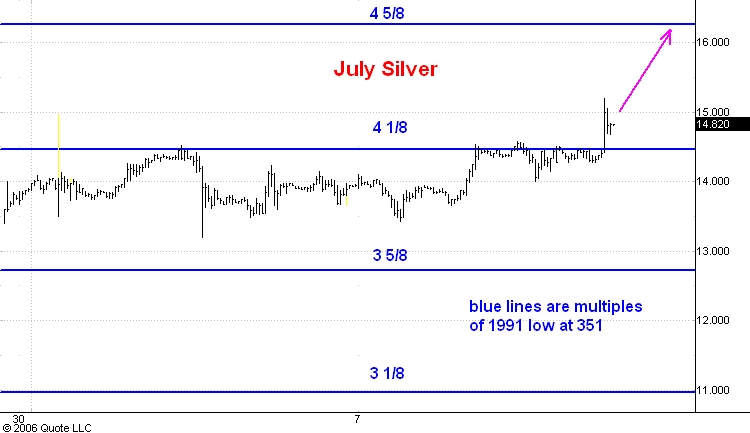
Here is an hourly chart showing pit and electronic trading in July silver futures. I last commented on this chart here.

I thought that strong resistance near the 4 1/8 multiple of the 1991 low of 351 would hold but this morning the market broke decisively above that level. The next strong resistance is at the 4 5/8 mutiple near 1623 and I think that is where July silver is now heading.

S&P


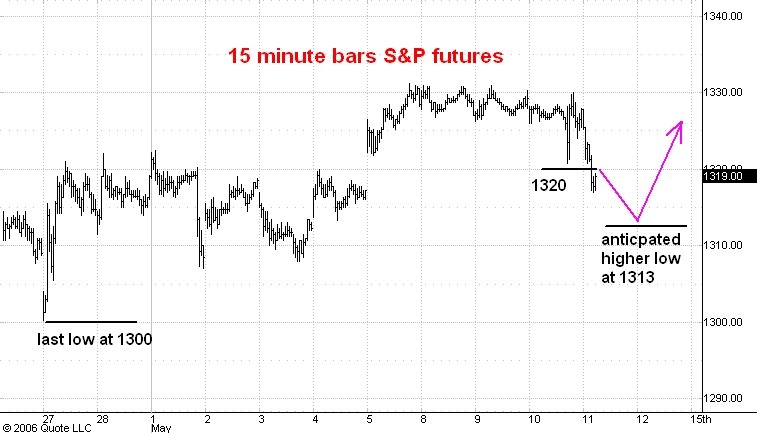
Here is a 15 minute bar chart showing regular hours trading in the June S&P e-mini futures. I last commented on this chart here.

This morning the market broke support at the 1320 level. The drop from 1331 already has a three phase shape and since I am bullish on stock prices I am anticipating a higher low around the 1313 level. From there we should see the start of a rally to 1350.

Crude Oil


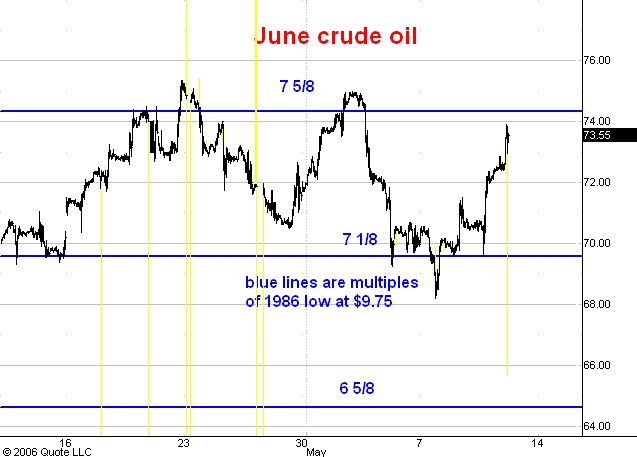
Here is a highly condensed hourl bar chart showing pit and electronic trading in June crude oil futures. I last commented on this chart here.

I thought that crude oil would drop to the 6 5/8 multiple of the 1986 low of 9.75 before it would rally as much as $3. In the even the market essentially has stayed within the trading range bounded by the 7 1/8 and the 7 5/8 mutliples. It is approaching the 7 5/8 multiple today and I think that the next move will be down to the 6 5/8 multiple near 64.60.

Guesstimates on May 11, 8:50 am ET

June S&P Futures: The market is headed for 1350.  Short term resistance is at 1335 while support is at 1320.

June Bonds: I think a move to 107-16 has started.

June 10 Year Notes: I think a move to 106-00 has started.

Euro-US Dollar: Short term downside target is 125.50 and if this level is reached I think a much bigger drop will be underway. The next big move should carry the market below 116.

Dollar-Yen: The market reached my 110.20 target. A rally to 112.10 is underway and the market  is preparing the ground for a big move up.  

June Crude: The  upside target at the 74.30 level, the 7 5/8 multiple of the all time low at 9.75, has been reached and I think the market is on its way below $60.

June Gold: The market is on its way to 725. Support is at 675.

July Silver: The 4 1/8 multiple of the 351 low which stands at 1440 was broken decisively this morning so I conclude that silver is on its way to the 1600 level.

Google: It looks like the drop from 455 is only the first phase of a three phase correction. I expect a rally into the 425-430 zone and then another drop to 370 or so. I still think GOOG will make it to 495.

Wednesday, May 10, 2006

Euro USD

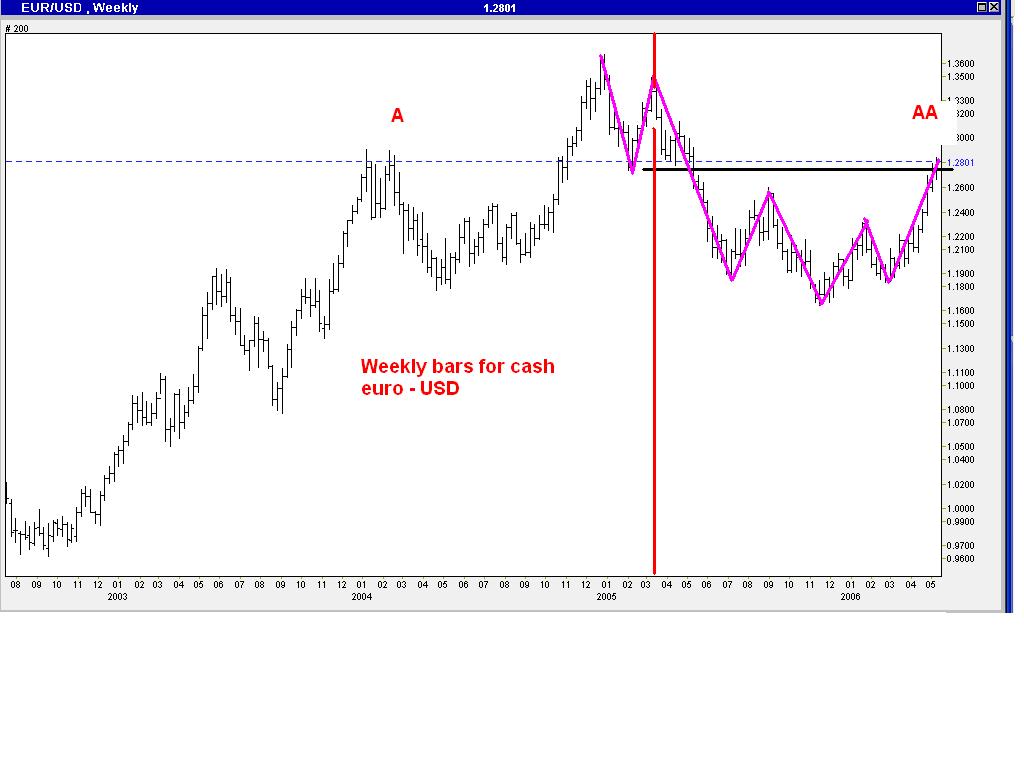
Here is a weekly chart of the cash euro-USD pair. I last commented on this market here.

I have a number of reasons to be bearish at this juncture. Perhaps the most important is the unreasoning bullishness shown by so many who expect the US Dollar to go into the tank here.

But I have other technical reasons for my view. On the chart you can see the drop from the 136.66 top in December 2004 does not have the obvious three phase look of a completed corrective move. On the other hand, the move up from the 116.40 low made in November 2005 does have a definite three phase look. The market has rallied about 1200 points from its low, just about as long a correction as the two big corrections within the big move up from 100.00 in 2002 to the 136.66 high in late 2004.

I have illustrated an obvious symmetry in this chart which makes it an example of a Lindsay foldback chart. The center line is drawn through the 134.79 top in March 2005. The lows on either side of this center line occurred nearly the same length of time from the center line and at nearly the same price level. The top at 129.27 labeled A occurred in February 2004, 13 months prior to the center line. The foldback symmetry then predicts a top (labeled AA) 13 months after the center line, i.e. in May 2006 near the 129.27 level. Today the market has rallied as high as 128.30.

I think the next big move in the euro-USD will be downward. This foldback chart predicts a low near 108 about 18 months after the center line. This would be September 2006.

S&P


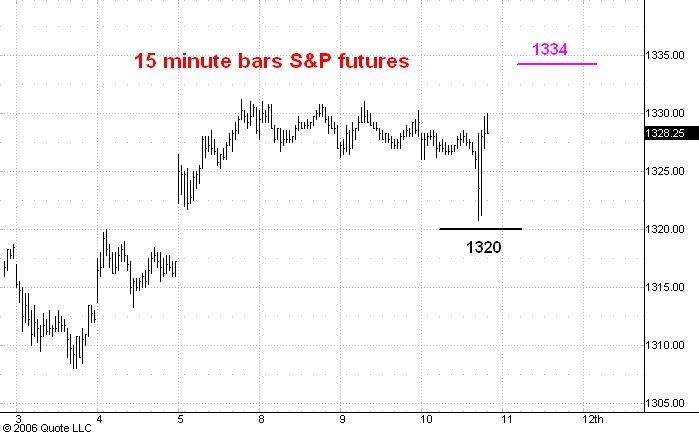
Here is a 15 minute bar chart showing regular hours trading in the June S&P e-mini futures.

Less than an hour ago the Fed raised the funds rate by 25 basis points to 5.00%. The market broke sharply after the announcement but as you can see support at the 1320 level held. I think the next step up should reach 1334 and that the market should be trading near 1350 in a couple of weeks.

The week of June 5 is still the ideal time for a bull market top, but frankly I still don't see the optimism about the future normally associated with long lasting highs in stock prices. We'll have to wait to see whether this situation starts to change.

Baidu


Here is a daily chart of Baidu.com, the Chinese version of Google. I last commented on this chart here.

After yesterday's close Baidu announced earnings and BIDU has since rallied over 80. There is resistance at 83, the 1 7/8 multiple of the 44.44 low, but any reaction from there should find support near the 70 level.

A reasonable upside target for BIDU is the 93 level, the 2 1/8 multiple of the 44.44 low.

Guesstimates on May 10, 8:50 am ET

June S&P Futures: The market is headed for 1350.  Short term resistance is at 1335 while support is at 1320.

June Bonds: I think a move to 107-16 has started.

June 10 Year Notes: I think a move to 106-00 has started.

Euro-US Dollar: I don’t think the market will move much past 127.50 before beginning an extended drop. Short term support is at 127.25 and weakness below there will mean a big break has started. I think the next big move should carry from here to below 116.

Dollar-Yen: The market has nearly reached my 110.20 target. I think we will now see some sideways action preparing the ground for a big move up. Resistance today is at 111.30.

June Crude: The  upside target at the 74.30 level, the 7 5/8 multiple of the all time low at 9.75, has been reached and I think the market is on its way below $60.

June Gold: The market is on its way to 725. Support is at 675.

July Silver: I think silver has started a move to 920 or so. Resistance above the market is at 1445.

Google: It looks like the drop from 455 is only the first phase of a three phase correction. I expect a rally into the 425-430 zone and then another drop to 370 or so. I still think GOOG will make it to 495 before it drops below 331.

Tuesday, May 09, 2006


hourly chart of June gold futures

Gold

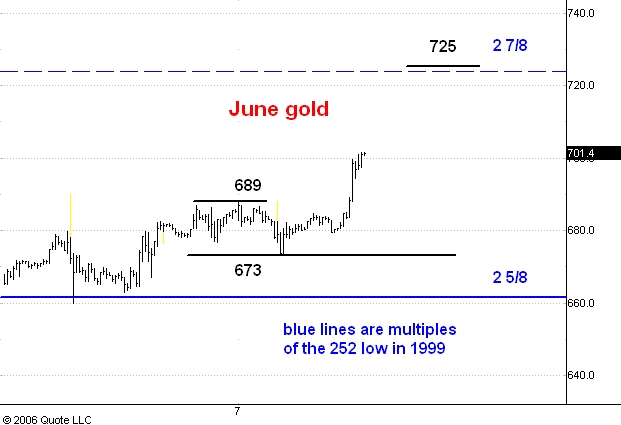
Here is an hourly chart showing pit and electronic trading in June gold futures. I last commented on this chart here.

This morning the market broke above the 689 level which had been resistance. The next upside target is 725, the 2 7/8 multiple of the 252 low in 1999. Generally speaking bull markets do not end at 3/8 or 7/8 mulitples so I think it is reasonable to expect continuation up to the 3 1/8 multiple at 787 before a bear market sets in.

Gold has advanced 70% during the past year and 50% over the past 6 months. The monthly chart is showing near vertical movement over the past couple of months and I think this is a very unstable situation. So the first break of a reaction low will probably begin an extensive drop if not a new bear market. Right now the 673 level is the last reaction low to watch for this purpose.

Guesstimates on May 9, 8:50 am ET

June S&P Futures: The market is headed for 1350.  Short term resistance is at 1335 while support is at 1320.

June Bonds: I think a move to 107-16 has started.

June 10 Year Notes: I think a move to 106-00 has started.

Euro-US Dollar: I don’t think the market will move much past 127.50 before beginning an extended drop. Short term support is at 126.45 and weakness below there will mean a big break has started. I think the next big move should carry from here to below 116.

Dollar-Yen: The market will probably continue down to  110.20 before a big move up begins. Resistance today is at 112.00.

June Crude: The  upside target at the 74.30 level, the 7 5/8 multiple of the all time low at 9.75, has been reached and I think the market is on its way below $60.

June Gold: Any drop below 675 support will indicate the start of a move below the 600 level. In the meantime resistance above the market is at 687.

July Silver: I think silver has started a move to 920 or so. Resistance above the market is at 1445.

Google: It looks like the drop from 455 is only the first phase of a three phase correction. I expect a rally into the 425-430 zone and then another drop to 360 or so. I still think GOOG will make it to 495 before it drops below 331.

Monday, May 08, 2006

Silver


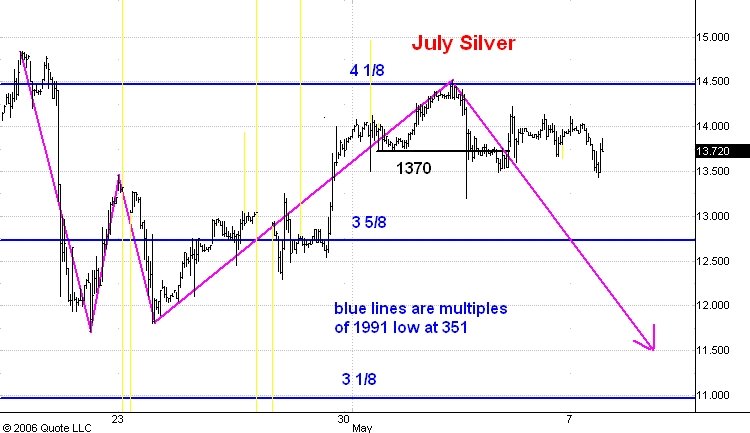
Here is a highly consensed hourly chart showing pit and electronic trading in July silver since its high at 1484 on April 19. I last commented on this chart here.

Silver is clearly stalling after a rally to a top lower than the 1484 top three weeks ago. I think this meanst that the market will soon take out the intervening low at 1171. When and if it does I think the drop will continue down to 920 or so.

Gold


Here is an hourly chart showing pit and electronic trading in June gold. I last commented on this chart here.

Gold has bounced of off 688 resistance twice but has yet to break below support at 675, the last low on the way to the high. I am guessing that the 675 level will soon be broken and when it is the market will be on its way down below the 600 level.

Crude Oil


Here is a highly condensed hourly chart showing pit and electronic trading in June crude oil futures. I last commented on this chart here.

I think we are still in the early stages of a drop that will carry the market to 60.00 and probably much lower than that. In any event June crude has accelerated well below the support level near 69.50 which is the 7 1/8 multiple of the 1986 low at 9.75. So I conclude that we should soon see the 64.60 level, the 6 5/8 mutiple, and from there a rally of $2 to $4 would be a reasonable expectation.

Guesstimates on May 8, 8:50 am ET

June S&P Futures: The market is headed for 1350.  Short term resistance is at 1335 while support is at 1320.

June Bonds: I think a move to 107-16 has started.

June 10 Year Notes: I think a move to 106-00 has started.

Euro-US Dollar: I don’t think the market will move much past 127.50 before beginning an extended drop. I think the next big move should carry from here to below 116.

Dollar-Yen: The market broke below 112.00 last night and will now probably continue down to  110.20 before a big move up begins. Resistance today is at 113.00.

June Crude: The  upside target at the 74.30 level, the 7 5/8 multiple of the all time low at 9.75, has been reached and I think the market is on its way below $60.

June Gold: Any drop below 660 support will indicate the start of a move below the 600 level. In the meantime resistance above the market is at 687.

July Silver: I think silver has started a move to 920 or so. Resistance above the market is at 1445.

Google: It looks like the drop from 455 is only the first phase of a three phase correction. I expect a rally into the 425-430 zone and then another drop to 360 or so. I still think GOOG will make it to 495 before it drops below 331.