
For nearly two years I have been following the development of an example of George Lindsay's Three Peaks and a Domed House formation in the Dow and in the S&P 500.
The first chart you see above is a schematic showing the ideal pattern with the associated numbering of the sequence of highs and lows.
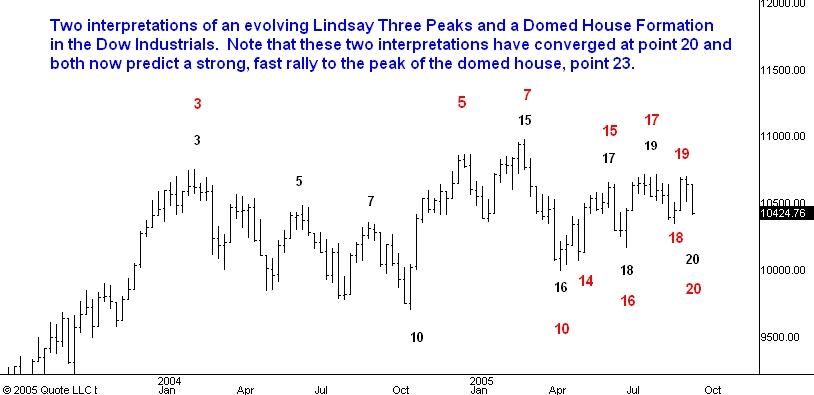
The second chart is a weekly chart of the Dow Industrials. I have put two sets of labels on this chart. Both the red labels and the black labels are possible interpretations of the Dow's action since January 2004 in terms of a three peaks and domed house.
We are now in a situation where both interpretations have converged; in other words, they both tell me that the market is now at point 20 of the domed house. Therefore, according to either interpretation, the next swing should be a fast rally upward to the top of the domed house, point 23.
As to timing, the "red" interpretation has the advantage of giving us a well defined and obvious point 14: May 13, 2005. This is Lindsay's preferred starting point for his time measurement of 7 months 10 days which then predicts point 23 for December 23, 2005. At the moment this is my best guess for the timing of the bull market top which would end the advance from the 2002 low.
2 comments:
carl:
i know your follow this theory..and you have stated target of 1350 on s&p..now one of the dow theorist had mention if S&P break 1250..then we can go up 200 points..which would take to 1450,which is about 100points higher than your target.. would you agree with that target?
Carl, Regarding your December 23 topping estimate, I have an exact hit for December 22 using the geometric time line from the March 03 low to the 2005 high price. This line is the outside uptrend line of the entire bull market to date. For my purposes I use the constant ("perpetual")3 months forward SP500 futures with five day weeks for geometric consistency.
Post a Comment