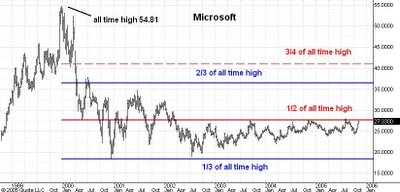
Here is a weekly chart of Microsoft since its all time high of 54.81 in late 1999. (Note that the prices shown on the chart have been adjusted for dividend payments.)
I have drawn the divisions of the all time high in blue and red.
MSFT has traded sideways for 5 years now since its low at 18.39 in December 2000. I think this is preparation for a very big upmove which will carry to new all time highs. In the meantime I am expecting a breakout above the 28 level which will carry MSFT to the 2/3 division point near 36 and then to the 3/4 point at 41.
1 comment:
in your opinion Carl, when do you think the BULL market will end?
any timing? and what is your minimum target on NASDAQ?
Post a Comment