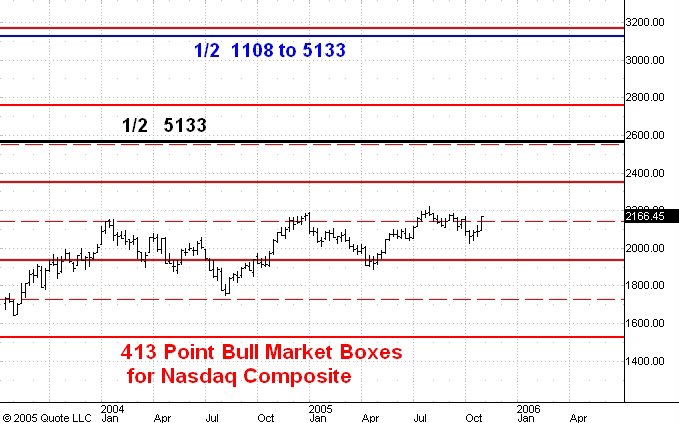
Here is a weekly chart of the Nasdaq Composite index.
I've commented on this chart previous posts here , here and here.
My views have not changed. I think a move up to 2566 which is 1/2 the all time high of 5133 is a virtual certainty while an even bigger move to 3130, the halfway point of 2000-2002 bear market is an even bet. This bull market has much further to go.
No comments:
Post a Comment