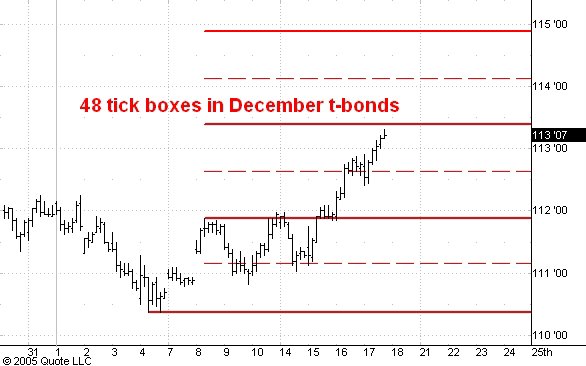
Here is an hourly chart showing pit trading in the December t-bond futures.
I've drawn the 48 tick boxes for the uptrend which began from 110-12 on November 4. My best guess right now is that the market will rally close to the 1/2 point of the next box up from here near 114-04 and then react. I think it will stop shy of that level by a few ticks.
Looking further ahead I think this market will get up to at least 115-08. I suspect it will go up even more than that because of the extensive bearish sentiment among the public. But I don't want to get too enthusiasic about its upside potential just yet because my monthly chart developed a long term bearish signal at the end of October which portends a move down at least to 107 in 2006.
No comments:
Post a Comment