Monday, June 13, 2005


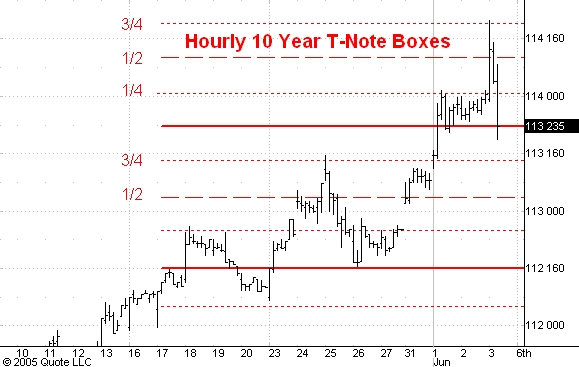
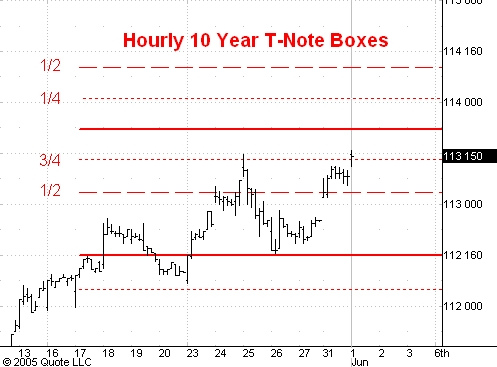
Hourly Chart of 10 Year Note Futures Posted by Hello

Bond and Note Update

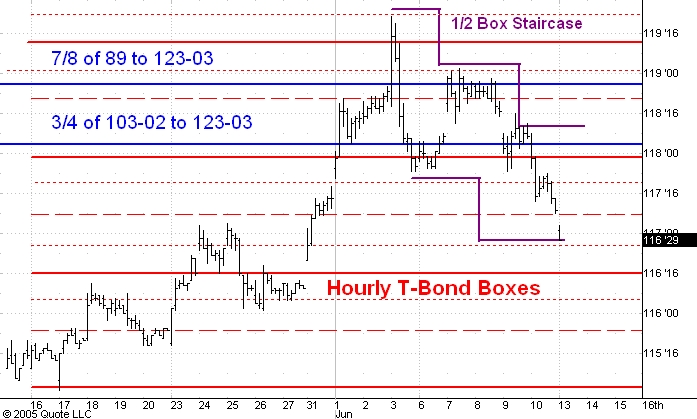
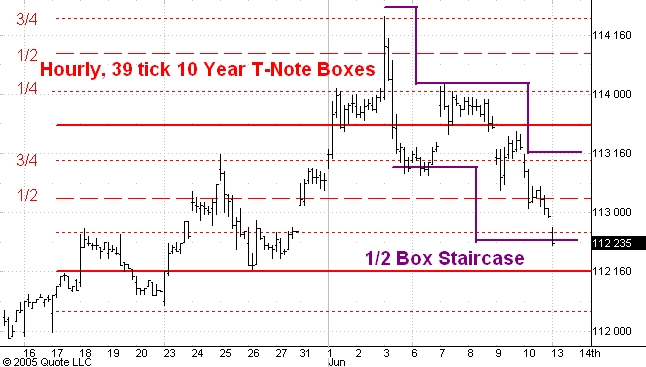
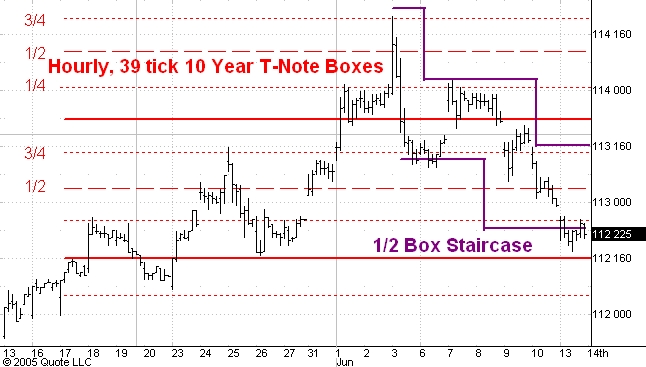
In a post earlier today I said that the T-bonds and 10 Year Notes had both reached their staircase targets for the reaction down from the June 3 highs and that both markets should be headed upward.

In the event there was a little more downside action than I expected but both markets have bounced off the bottom of a price box. The bonds should rally at least a box (46 ticks) from their lows but will probably go up more to 119-00 or so. The notes should rally a box (39 ticks) from their lows.

Hourly Chart of IBM Posted by Hello

IBM Will Breakout

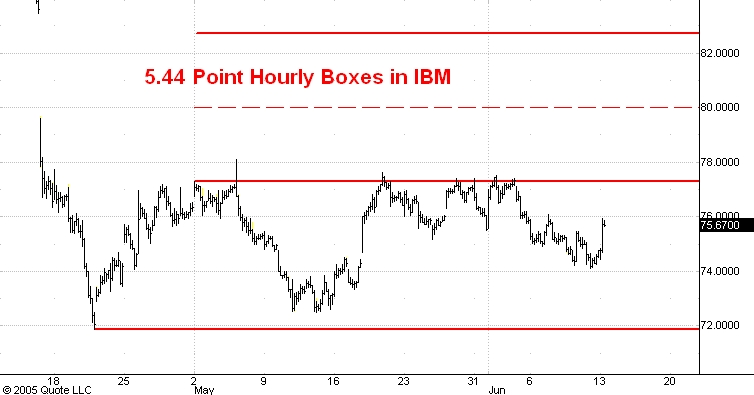
Here is a look at the hourly chart price boxes in IBM. In a previous post I predicted that IBM would reach 106 by the end of the year. At the moment it looks to me like IBM has begun a breakout move which will carry it to the ½ point of the next box at 80.00 and then to the top of the same box at 82.70.

Squawk Blog Makes Fun of Google

Jokes and jeers are sometimes good clues to market sentiment. Humor often arises from a certain "lack of respect". CNBC's Squawk Blog just ran a poll on the best name to give Google stock zealots. Here are the results.

This is just another piece of evidence that GOOG is still far from its ultimate top.

The Slope of Hope

Mark Hulbert has just posted a column on MoneyWatch entitled “The slope of hope”. He argues that the short term stock market timers he monitors have become very much more bullish than they were at the April 2005 low and that this has bearish implications for stock prices.

You probably have guessed that I don’t agree with his conclusion. And this illustrates why I don’t rely on newsletter survey data to form the basis of my contrary opinion thinking. I have observed that public sentiment changes very slowly, so when it reaches a bearish extreme as it did in April it will take some time (certainly more than 6 weeks) for it to return to neutral levels, let alone bullish ones. On the other hand newletter writers can change positions on a dime.

My basic starting point for contrary opinion thinking is that media are in the business of telling people what they want to hear. So if you observe what the media are saying you can get a good idea of what people’s attitudes are towards the market. Most commentators, especially the market technicians, are currently telling their readers to be bearish. So my current reading of investor sentiment is that it is still basically bearish. Mark Hulbert is one such commentator. As another example, take a look at this column in Barrons’ Online.

I think that public sentiment is still bearish enough to support a rally to 1350 in the S&P by the end of this year.

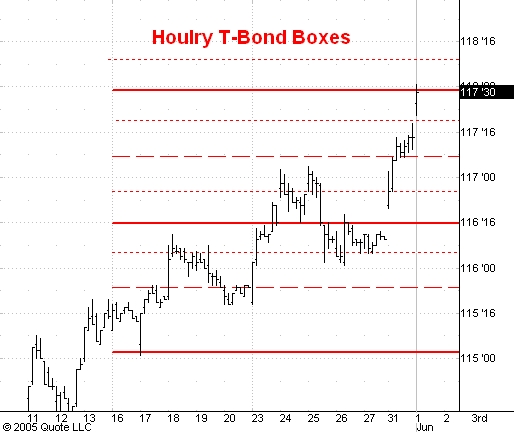
Hourly Chart of T-bond Futures Posted by Hello

Hourly Chart of 10 Year Notes Futures Posted by Hello

Bond and Note Staircases

As you can see on the hourly charts above, both the T-bond and the 10 Year Note futures have dropped to the next step down in their staircase reactions from the employment number highs. I expect both markets now to rally a least a full box.

Guesstimates on June 13, 8:25 am ET

S&P: headed for 1224. Support at 1197.

Bonds: market is now headed back to 119-00.

10 Year Notes: 112-20 is support and market should now rally back to 114-00.

Eurocurrency: 120.85 is support. I expect a rally of at least 500 points to start here or at worst from 119.90.

Crude: 54.40 is resistance and next step down should reach 51.00

Gold: now headed for 436.

Google: 277 is support and market should next rally into the 308-312 range

Sunday, June 12, 2005


Hourly Chart of Google Posted by Hello

Google Update

In a previous post I had predicted that Google would reach 301 before any reaction of more that 20 points set in. So far GOOG has made it as high as 299.59. The hourly chart above shows that the advance from the last significant low at 175 is starting to loose steam.

GOOG has started to show a small rising staircase of highs. The first high was at 292.65 on June 1 near the ¼ point of the box at 291.60. The second high was at 299.59 on June 7 just shy of the ½ point of the box at 301.60. I think the next rally will carry the market up ¾ box or 30 points from the reaction low at 278 and end near the ¾ point of the box which stands at 311.60. This presents a target range of 308-311 for the next rally.

Longer term I think that GOOG has much further to go, at least to the 376 level.

Mr. Bubble

According to an editorial in today’s New York Times, Alan Greenspan is “Mr. Bubble”.

The Times thinks that Greenspan kept rates too low for too long and thus helped to inflate a housing bubble in the USA. From this one might imagine that the NYT editors think the cure for the bubble is continued increases in interest rates; after all, “bubbles” are bad and if they are inflated by low rates then they can be deflated by raising interest rates.

But reading on we find that the Times also thinks that low mortgage rates are a sign of weakness in the economy. So one must conclude that the Times thinks the thing to do in the face of economic weakness is to raise interest rates! Hmmm!

Of course, I don’t look to the New York Times for my economic analysis. Instead I look to the Times for a read on elite opinion and that is usually a good starting point for thinking along contrary lines.

Let’s take a closer look at the “Mr. Bubble” editorial. The NYT thinks that low long term interest rates are a sign that the economy is or soon will be sliding downhill. Here are some interesting quotes:

“[The] economy …is not doing as well as Mr. Greenspan suggests.”

“[The] economic outlook is worrisome.”

“[The} federal budget [is] deep into the red, setting the stage for slower growth”.

“”Meanwhile, it is hard to take Mr. Greenspan’s reassuring talk about the economy seriously when there is so much evidence to the contrary.”

The Times suggested “cure” for this economic weakness is higher interest rates and higher taxes! Yikes!!!

My own view is that relatively low long term interest rates are a sign of the bond markets’ confidence that inflation will remain low for the foreseeable future. Low rates also mean that the pool of global savings is large and growing. Savings are the fuel for economic growth. This together with the fact that stock prices have gradually risen in the face of a two year tightening program by the Fed tells me that the economy is in good shape and will continue to strengthen.

Friday, June 10, 2005


Hourly Chart of Cash Nasdaq 100 Index Posted by Hello

Hourly Boxes for Cash Nasdaq 100 Index

The chart above shows my estimate of the hourly boxes in the cash Nasdaq 100 index starting from the April 29, 2005 low at 1394. These boxes as 63 points high.

The market has reacted to the bottom of its third box and the target for the next upswing will be the ½ point of the fourth box at 1615.

Hourly Chart of September Eurocurrency Futures Posted by Hello

Hourly Eurocurrency Boxes

I expected support at 122.20 in the September Eurocurrency to hold and be followed by a move up to 125.00. Instead the market broke sharply this morning as you can see on the hourly chart above.

This does not change my basic view that the market is on the verge of a several hundred point rally. But now it looks like this rally will start from the ½ point of the next lower box which stands at 120.85.

Hourly Chart of September T-bonds Posted by Hello

Bond Staircase

The hourly bar chart above depicts a staircase in the September bonds. The hourly boxes are 46 ticks high and the staircase has steps of ½ box or 23 ticks. The presumption is that the bonds are headed down the staircase to support at the ¼ division point of a box at 116-28.

This reaction is the biggest one in the bonds in several weeks. I anticipated a substantial reaction because the market had rallied into resistance defined by the confluence of the two range divisions drawn in blue on the chart.

Guesstimates on June 10, 8.:35 am ET

S&P: headed for 1224. Support at 1202.

Bonds: resistance is at 118-12 and market is headed for 116-30.

10 Year Notes: resistance at 113-24 and now headed for 112-16 to 112-20.

Eurocurrency: going up to 125.00.

Crude: 54.40 is resistance and next step down should reach 51.00

Gold: reached support at 423-25 yesterday and now headed for 436.

Google: 277 is support and market now headed for 308.

Thursday, June 09, 2005


Hourly Chart of July Crude Oil Posted by Hello

July Crude Oil Hourly Boxes

This morning I guessed that July Crude would rally to the top of its second bearish box at 53.40 and then resume its decline. The market proved strong than I expected but I think that the resistance at the ½ point of the first box at 54.40 will hold. The next move should be downward to 51.00 or lower.

Hourly Chart of August Gold Posted by Hello

Hourly Gold Boxes

I think that gold made an important low on May 31 at 412.00 in the June contract. Above you will see an hourly chart of the August contract. I’ve drawn in the boxes which I currently estimate will be $13.70 high. August gold has reacted to the ½ point of the first box and the next step up in its staircase should be to the ½ point of the second box at 436.40. I think gold is headed over 500 this year.

Hourly Chart for September S&P Futures Posted by Hello

September S&P Boxes

September is now the front month for the S&P futures. The hourly chart above shows the hourly price boxes for this September contract. Notice that I just carried along the price boxes defined by the June contract which are 30 points high and started at 1137 (the day session low in April).

Support is at 1197, the bottom of the third box up from 1137 and I think the next move will carry close to the top of the same box at 1227. I estimate 1224 because I expect sellers to come in as the March top at 1229 is approached.

Guesstimates for June 9, 9:15 am ET

September S&P: support is at 1197 and the next swing up should carry to 1224.

Bonds: 117-30 is support but the rally from there will probably stop near 118-12. Then down to 117-00.

10 Year Notes: 113-04 is support but the supsequent rally will probably only carry to 113-24. then down to 112-16.

Crude: Almost made it to 52.00 overnight so look for a move to 53.30 then down again.

September Eurocurrency: should hold 122.20 level then up to 125.00.

Wednesday, June 08, 2005

Don't Fear the Fed!

Tomorrow morning Fed chairman Greenspan will again testify before Congress. Markets are on pins and needles awaiting his words. But will they really matter?

Greenspan’s tenure at the Fed began in 1987 and has been marked by a strong emphasis on making the Fed’s monetary policy as predictable as possible. The Fed wants to avoid surprising markets if it can. Tomorrow’s testimony will be no exception. I think that after the smoke clears following the Greenspan’s testimony you will find the bond market pretty much where it closed today.

This brings me to a more important point. If the Fed wants to be as predictable as possible then the markets have already discounted whatever interest rate increases the Fed has planned. So you have to look elsewhere for guidance as to the future direction of the bond and stock markets.

It is worth wondering why the stock market has moved gradually higher since March 2004, a period during which the Fed has raised short term interest rates 200 basis points. In the business of speculation it is the dog that doesn’t bark that often is the critical clue to the future. In this case a 200 point increase in rates would normally be expected to have a depressing effect on stock prices. The fact the averages rose a little bit instead means that underlying demand for stocks is very strong. This is a very bullish condition.

I am reminded very much of 1994. The Fed raised rates several hundred basis points in 15 months, but the stock market didn’t budge. When the Fed let it be known that it was near the end of its series of increases, what happened? Stock prices soared and the great stock market boom of the 1995-2000 began.

I expect a mini-version of this situation to be repeated now. The Fed will soon halt (temporarily) its moves towards higher rates and stock prices will advance 15-20%.

Don’t fear the Fed!

Guesstimates on June 8, 11:30 am

Google - 287 didn't hold but it looks like 278 ended the reaction. Still think 308 will be seen soon.

The Big Picture

Here are some educated guesses about longer term trends in markets that interest me.

S&P - Headed for 1350 by the end of 2005, then down 20-25% in 2006.

Bonds - up into 120-122 range then down to 100 by late 2006.

10 Year Notes - up to 116 then down to 104 by late 2006.

3-month Eurodollars - will reach 4.85% by the end of 2006.

Gold - up to 510 before the bull market ends.

Crude Oil - down to $ 27 over the next two years.

US Dollar index- up to 100 over the next year and to 121 by 2010

Eurocurrency - down to 107 over the next year and to 80 by 2010

Google - up to 376 by the end of 2005

IBM - up to 108 by the end of 2005

Microsoft - up to 42 by the end of 2005

Is Google Overpriced?

Sure it is! James Stewart just posted a column on this subject here.

But you really want to know whether or not GOOG will get even more overpriced during the next 12 months. I think the answer is yes and I have explained my reasons here and here. Basically, GOOG is one of the few places day traders and hedge funds can “play” in an otherwise lackluster market. So I expect GOOG to inflate well past any reasonable notion of value.

The thing to remember is that booms, bubbles and busts always go further from fair value than a rational person expects them to. So if you are riding the GOOG tiger I suggest you hang on at least until it reaches my current 376 target or until it starts underperforming the Dow or S&P.

Guesstimates on June 8, 8:40 am ET

Bonds - I still think the market will hit 119-08 before dropping to 117-30 or to 116-30.

10 Year Notes - still holding out for 114- 04 to 08, then down to 113-04.

Dec Eurodollars - stopped 2 ticks shy of 96.24 this morning and now will drop to 96.09.

S&P - Support is at 1197. Next upside target is 1213-1215.

Google - support is at 287 then up to 308.

Gold - down to 423-24 then up to 439.

July Crude - support at 52.00 then a small rally to 53.30 -53.50. Then much lower.

Eurocurrency - up to 123.40

Tuesday, June 07, 2005

Guesstimates June 7, 12:20 pm ET

Google - support at 287 the up to 308

Guesstimates 10 AM ET

Bonds - continuing up to 119-08 but a lower top is likely there. Then down to 117-30 or 117-02.

10 Year Notes - continuing up to 114-08 but then down to 113-04.

Eurodollars (Dec) - rally should stop at 96.26 then down to 96.09.

Time Magazine Forecasts End of Boom

Well it finally happened. Time Magazine's June 12 issue has a cover story on the real estate boom in the US. This follows upon the heels of Fortune Magazine's May 30 cover story "The Real Estate Gold Rush".

Is the US real estate boom over? Is it a bubble that is about to pop?

Paul Montgomery originated the use of magazine cover stories as contrary opinion indicators in the early 1980's. His research showed that for a period of 1 to 3 months after the cover story markets tend to continue in the direction suggested by the story (in this case, upward). After that markets reverse course and move in the opposite direction.

But there are two important caveats to keep in mind.

First, bullish stories like these about the real estate boom generally are less accurate as timing indicators than are bearish stories. Greed is a more diffuse and less intense emotion that fear. So bullish stories often precede market tops by as much as a year. Moreover they give false indications much more frequently than do bearish stories. For an example of this see the September 20, 2004 Fortune cover on the US real estate boom.

The second caveat concerns the nature of the housing market. Houses cannot be bought or sold as easily as stocks and bonds. Moreover, most of the US housing stock is owner-occupied and so is held for the services it provides, not just as an investment. For this reason too a bullish story on the housing market is less likely to time precisely the top than one on some financial asset.

All in all I think that the real estate boom in the US won't cool down until the economy starts sliding into the next recession. My 2005 stock market forecast predicts a bull market top later this year. If this is correct then the economy won't start showing signs of weakness until mid- 2006.

The real estate boom will probably continue for another 12 months.

Monday, June 06, 2005

Index of Daily Guesstimates

Here is an index my daily guesstimates made in real time during 2005. These are very short term views of markets that interest me. I call them guesstimates because a lot of guesswork is involved in these projections.

GUESSTIMATES DURING 2005

DECEMBER

December 30 - 8:50 am ET
December 29 - 8:50 am ET
December 28 - 8:40 am ET
December 27 - 8:50 am ET

December 23 - 8:50 am ET
December 22 - 8:40 am ET
December 21 - 8:50 am ET
December 20 - 8:50 am ET
December 19 - 8:50 am ET

December 16 - 8:50 am ET
December 15 - 8:55 am ET
December 14 - 8:55 am ET
December 13 - 8:55 am ET
December 12 - 8:55 am ET

December 9 - 9:00 am ET
December 8 - 8:50 am ET
December 7 - 8:40 am ET
December 6 - 8:55 am ET
December 5 - 8:55 am ET

December 2 - 8:40 am ET
December 1 - 9:50 am ET

NOVEMBER

November 30 - 9:00 am ET
November 29 - 9:15 am ET
November 28 - 8:40 am ET

November 25 - 9:40 am ET
November 23 - 8:40 am ET
November 22 - 8:40 am ET
November 21 - 8:50 am ET

November 18 - 8:50 am ET
November 17 - 8:50 am ET
November 16 - 8:50 am ET
November 15 - 8:50 am ET
November 14 - 9:00 am ET

November 11 - 8:45 am ET
November 10 - 9:10 am ET
November 9 - 8:50 am ET
November 8 - 9:10 am ET
November 7 - 8:50 am ET

November 4 - 8:45 am ET
November 3 - 8:50 am ET
November 2 - 8:50 am ET
November 1 - 8:50 am ET

OCTOBER

October 31 - 8:50 am ET

October 28 - 8:50 am ET
October 27 - 8:50 am ET
October 26 - 8:50 am ET
October 25 - 8:55 am ET
October 24 - 8:45 am ET

October 21 - 9:00 ET
October 20 - 8:50 am ET
October 19 - 8:50 am ET
October 18 - 8:50 am ET
October 17 - 8:55 am ET

October 14 - 8:55 am ET
October 13 - 8:45 am ET
October 12 - 8:50 am ET
October 11 - 8:50 am ET
October 10 - 9:10 am ET

October 7 - 9:10 am ET
October 6 - 9:10 am ET
October 5 - 8:45 am ET
October 4 - 8:45 am ET
October 3 - 8:55 am ET

SEPTEMBER

September 30 - 8:40 am ET
September 29 - 8:45 am ET
September 28 - 8:55 am ET
September 27 - 8:50 am ET
September 26 - 8:50 am ET

September 23 - 8:45 am ET
September 22 - 8:45 am ET
September 21 - 8:55 am ET
September 20 - 8:50am ET
September 19 - 8:45 amET

September 16, 8:55 am ET
September 15, 8:50 am ET
September 14, 8:45 am ET
September 13, 8:50 am ET
September 12, 9:15 am ET

September 9, 8:50 am ET
September 8, 8:45 am ET
September 7, 8:45 am ET
September 6, 8:45 am ET

September 2, 9:10 am ET
September 1, 9:10 am ET

AUGUST

August 31, 8:55 am ET
August 30, 8:45 am ET
August 29, 8:45 am ET

August 26, 8:50 am ET
August 25, 8:45 am ET
August 24, 8:40 am ET
August 23, 8:30 am ET
August 22, 8:45 am ET

August 19, 9:05 am ET
August 18, 8:50 am ET
August 17, 9:05 am ET
August 16, 8:50 am ET
August 15, 9:00 am ET

August 12, 8:30 am ET
August 11, 8:45 am ET
August 10, 8:45 am ET
August 9, 8:50 am ET
August 8, 8:40 am ET

August 5, 8:50 am ET
August 4, 8:45 am ET
August 3, 8:45 am ET
August 2, 8:45 am ET
August 1, 8:50 am ET

JULY

July 29, 8:50 am ET
July 28, 8:50 am ET
July 27, 8:55 am ET
July 26, 8:45 am ET
July 25, 8:50 am ET

July 22, 8:50 am ET
July 21, 8:50 am ET
July 20, 8:30 am ET
July 19, 8:40 am ET
July 18, 8:40 am ET

July 15, 8:40 am ET
July 14, 8:50 am ET
July 13, 9:00 am ET
July 12, 8:50 am ET
July 11, 9:10 am ET

July 8, 8:50 am ET
July 7, 8:55 am ET
July 6, 9:00 am ET
July 5, 8:40 am ET

July 1, 8:45 am ET

JUNE

June 30, 8:50 am ET
June 29, 8:35 am ET
June 28, 8:15 am ET
June 27, 8:25 am ET

June 24, 8:30 am ET
June 23, 8:30 am ET
June 22, 8:15 am ET
June 21, 8:55 am ET
June 20, 9:00 am ET

June 17, 9:15 am ET
June 16, 8:35 am ET
June 15, 8:45 am ET
June 14, 8:30 am ET
June 13, 8:25 am ET

June 10, 8:35 am ET
June 9, 9:15 am ET
June 8, 11:30 am ET
June 8, 8:40 am ET
June 7, 12:30 pm ET
June 7, 10am ET
June 6

June 6 Guesstimates

Here are my very short term views on some markets:

S&P - today' low at 1193.20 should hold and the next step up will carry into the 1212 to 1215 range.

T-bonds - rally to 118-24 and then back down to 117-30 or 17-02.

10 Year Notes - 113-04 is support and a move up to 113-24 from there would be normal

Crude - the 55.00 level is good resistance and the next big swing should be downward.

Eurocurrency - headed up to 124.40.

Gold - 429 is a temporary halting price and a drop to 425 from there is likely.

Google - Up to 308. the 277 level is good support.

Daily Chart of December 2005 Eurodollars Posted by Hello

Eurodollars

The daily chart you see above shows my current box analysis for the December 2005 Eurodollar futures. The bear market boxes are 48 ticks high and have been descending from the June 2003 high at 99.09. In my last post on the Eurodollars I said that the market would probably resume its bearish trend once the 96.33 level was reached. Now I think that there may be a little more upside potential so I want to update the last analysis.

I've drawn in purple the staircase levels for the rally from the March 2005 lows. Last Friday the market bounced off the 1/4 point of a box at 96.33. This is only a 1/4 box progress past the previous top at 96.20 on April 19 and shows that the Euros are much closer to their ultimate rally top than are the bonds and notes.

Since the preceding top was only a 1/4 box progression from the preceding top the upcoming low will be only a 1/4 box progression from the preceding low. This would put the upcoming low at 96.09. The rally from there will probably carry the market to the 1/2 point of the next higher box at 96.45. After that level is reached I expect the bear market in the Eurodollar to resume.

Hourly Chart of June Eurocurrency Futures Posted by Hello

Daily Chart of June Eurocurrency Futures Posted by Hello

Eurocurrency Update

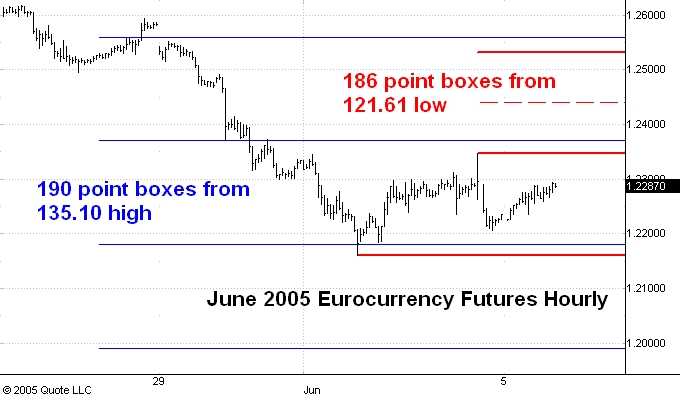
In my last post on the Eurocurrency I said that the market had reached strong support at the 3/4 division point of its historical range and at the 1/2 point of its second bear market box and that a substantial rally was imminent. I'd like to update the situation now and look at an emerging system of boxes for the rally which I am anticipating.

The daily chart above shows that the market has traded sideways for a few days at these support levels so I think it is a buy. Even if I am wrong about this I would then expect the119.90 level, the bottom of the next hourly box for the downtrend from 135.10 (in blue) to halt the drop and then generate a rally to 125 or higher.

But I think that the 121.61 low will hold and that the market is about to rally from here. How far will the next step up in its staircase carry? My best guess is that the next reaction will start from 124.40, the 1/2 point of the second box drawn in red. The red boxes are defined by the initial 186 point rally off of the low of 121.61 and should control the uptrend from that level.

Hourl Chart of June 2005 S&P Futures Posted by Hello

S&P Staircases

I like to think of a market's trend as a staircase. An uptrend is a series of steps upward consisting of successively higher highs and higher lows. A downtrend is a series of steps downward consisting of successively lower lows and lower highs.

Anyone who has studied market behavior knows that this description is a very impressionistic one. It can be very difficult to translate it into actionable trading rules. The best way I have found to do this is based on my box theory.

Once a box size has been identified within an uptrend each successive top is generally some multiple of half the box size above the last top. Usually it is 1/2 or 1 box size above it but in an acceleration phase one can see 1 1/2 or rarely 2 box size separations between successive tops. The same rule applies to successively higher lows within and uptrend. In a downtrend one follows the same guideline but then of course the tops and bottoms are successively lower.

The main idea is that each top is related by a box size multiple to the previous top and each bottom is related by a box size multiple to a previous bottom.

The hourly chart above depicts the trading boxes(drawn in red) in the June 2005 S&P futures. My estimates of the staircase levels are drawn in purple.

Before looking at this chart in more detail I want to make another observation. This staircase approach requires a real artistic input by the speculator who uses it. The best way to develop the feel you need to see staircases is to practice on lots of examples and to do this in real time. Remember that in speculation everything is obvious in hindsight but you can't make any money predicting the past!

This S&P example is not a terrifically neat one but it illustrates the ambiguities one faces when trying to see staircases.

The June S&P made it's day session low on April 20 at 1136.80. The subsequent rally halted at 1167 and thus defined a box 30 points high. After the 1167 top was broken we can make a guess at the first step in the bullish staircase of lows. Since it is early in the trend we guess that the first subsequent low will be at 1152 which is 1/2 a box above the initial low. The actual low was 1147.20. Once the market makes a new high by at least 1/2 box following the 1147.20 low we want to estimate the position of the next step up for the lows. My best guess would be a full box size above 1152 (NOT above 1147.20 , the actual low!). This is the 1182 level.

Note that the market reacted only to 1186.50 so someone who insisted on buying only on a drop to 1182 would have been left behind. But as a practical matter this should not have been a problem. Note that a few days earlier on the initial break above the 1182 level the market formed a little shelf of lows at 1185. Since one already assumes the market is in an acceleration mode by choosing a full box size above 1152 instead of 1/2 a box, it is reasonable to think that the lows at 1185 would not be broken on the subsequent reaction.

So far we have been predicting the past. What about the future? After the 1186.50 low the market struggled to a new high. So our estimate of the next step up for the lows in the uptrend should be 1/2 box above 1182 (NOT 1186.50 - the actual low!). This is the 1197 level which the market is flirting with as I write this. On this basis I believe that the next move of 10 points or more from 1197 will be upward.

Next let's look at the highs in the uptrend. After the high of the initial box at 1167 was made the normal expectation would be for the next high to be at 1182, 1/2 a box above 1167. After 1182.30 was reached overnight (not shown on the chart which records only daytime activity) the market broke to 1147.20. It would then be reasonable to expect an acceleration phase to begin and this would predict the next stop at the 1212 level, a full box above 1182. But the market began to struggle after it broke above 1190 so it made sense to scale back the estimate to only a 1/2 box progression above 1182. This would be the 1197 level and the market formed a small top at 1199 and dropped to 1186.50.

As to the future, the most conservative estimate would be for a rally to 1212, a 1/2 box move above 1197. But I think it is at least as likely that the market moves a full box above 1197 to 1227 (near the March high) before a reaction of half a box or a full box sets in.
Sunday, June 05, 2005

Double, Double Toil and Trouble

"Double, double toil and trouble; Fire burn and cauldron bubble" (from William Shakespeare's Macbeth).

These lines of Shakespeare are a perfect accompaniment to today's New York Times Magazine article by Roger Lowenstein entitled "See a Bubble?". Like the three witches in Macbeth Americans today are anxiously watching the financial cauldron bubble, hoping to brew a potion that will ward off imminent disaster.

Here's Lowenstein's opening paragraph:

"It's a good time to be a financial-disaster writer. Disasters abound, and even when they don't, people are eager for your opinion on when the next bubble is going to pop. Scarcely a day goes by without a warning of some dire calamity - in the dollar, in housing values, in pension funds. The way people crave financial info, we must be the best-informed, most economically literate society ever. But we do not sleep any better for it. Is all the anxiety warranted, or even productive?"

My own answer to Lowenstein's (rhetorical) question is that all the anxiety is NOT warranted and is NOT productive. That Lowenstein can write this article and the New York Times publish it is ample evidence of my basic contention, one I have repeated on the blog many times: people are very worried about the future and bearish in general on financial assets. Under such conditions I think there is no chance that the stock market averages can drop over the next six to nine months.

Weekly Continuation Chart of 10 Year Note Futures Posted by Hello

Weekly Continuation Chart of T-bond Futures Posted by Hello

The Next Top in the Bond and Note Futures

The bond and the 10 year note futures have been moving up strongly from their lows at 109 and 107-26 respectively in late March 2005. In this post I will try to estimate just how far this rally will carry.

I take a "top down" approach to forecasting. By this I mean that I first try to assess the direction of the market's long term trend (which generally lasts a year or two). Once I have done this then I look for evidence that indicates the market's position within the intermediate term trend which generally lasts two to six months. My analysis of the intermediate term trend is always dependent upon my conclusion about the direction of the long term trend.

My 2005 bond forecast predicted that the 10 year notes would rally for the first 8 months of 2005 and top out in August. I also predicted that the 2005 top would be below the high prices reached in June 2003 (bonds at 124-12 and notes at 121-03). So I think that the bull market which began in the bonds and notes from lows in May 2004 (bonds at 103 and notes at 107-26) is rapidly approaching its end.

When a market is in a long term sideways trend or trading range it is usually helpful to look at the divisions of the range to try to get estimates of where intermediate term trends which typically last 2 to 6 months) will stop.

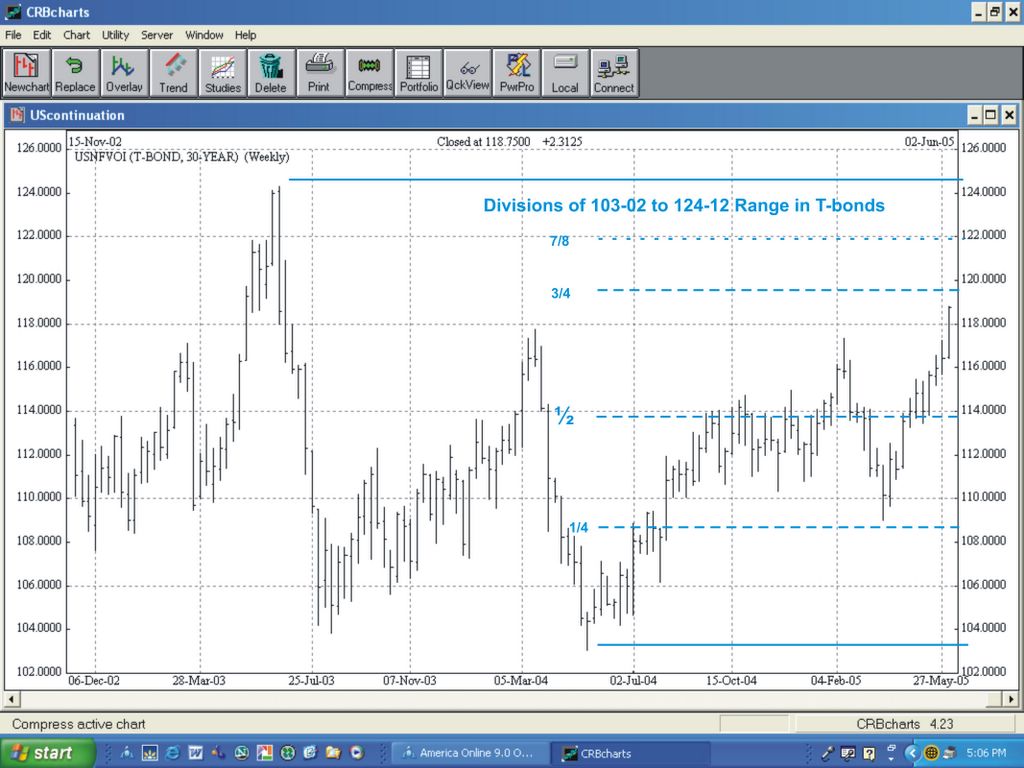
The weekly chart of the T-bond futures above shows the divisions of the range from the 124-12 high in June 2003 to the 103-02 low in May 2004. This past Friday (not shown on the chart!) the bonds traded as high as 119-23, just above the 1/2 division point at 119-01. I think the market will now trade sideways for a week or two in a range of three points or so. After that I think the bonds will move up to the 7/8 division point at 121-23 where the moves up from the March 2005 and May 2004 lows will end.

Why do I think this rally has further to travel? First of all, my 2005 bond forecast did predict a top for late summer and so the rally should still have a couple of months to go on this basis. But I don't like to rely too heavily on such long term predictions when it comes to trading decisions. A better reason for expecting a move up to 121-23 lies with a box analysis of the weekly chart. Note that there is an obvious price box delimited by the drop from the February 2005 high at 117-12 to the March 2005 low at 109. This box is 8.375 points in height. Adding 8.375 points to the high at 117-12 we get 125-24 as the top of the next box. But my long term forecast says that the market should not go above the 2003 top at 124-12. Next I observe that the 1/2 point of the next price box is at 121-18, not far from the 7/8 division of the range at 121-23. So this is the target I choose for the end of the uptrend.

The analysis of the 10 year notes is similar. The weekly chart depicts the divisions of the range from the 2003 top at 121-03 to the 2004 low at 107-26. At this juncture I think the market will move up to either the 5/8 division at 116-03 or to the 3/4 division at 117-08. The February 2005 top was at 113-13 and the March 2005 low at 107-26, a range of 5.59 points. Using this as the box size the 1/2 point of the next box up is at 116-06 so I think that 116-03 is the more likely target for the notes over the next couple of months.

Saturday, June 04, 2005

Take a Stand

Amateur speculators (and some professionals too!) often take pride in their willingness to "listen to the market". This usually means that they have some collection of technical indicators which provides information about the direction of the market's trend. The consensus of this collection of indicators then "tells" them whether to be long or short.

People who speculate in this way are usually "trend followers". In other words, they buy only after the market has gone up for a while and they sell only after the market has gone down for a while. There are a (very ) few individuals who have made substantial fortunes as trend followers. But the majority of trend followers has only losses to show for all its analytical effort.

I think trend following is a bad idea. People who do it generally end up as the yo-yo at the end of the market's string. They too often sell near the bottom and buy near the top and are soon out of business.

A better approach is to try to estimate the length of the market's string (to continue the yo-yo metaphor). In other words, try to estimate whether current prices are high or low relative to some idea of a normal price range. If you can do this you can begin to trade futures and stocks like you buy food, clothes, cars, computers etc.

I'm sure you like to take advantage of bargains and sales. You know how big a discount is normal and that discounts are usually available for only a limited time. You like to buy at a discount and defer purchases if things seem overpriced. On the other hand, the logic of trend following would require you to pass up these discounts and wait for the sale to end before buying! Not a good way to extend the purchasing power of your budget!

Identifying a normal discount or premium is the whole purpose of my box theory and of the technique for dividing historical ranges that I illustrate on this blog. These methods help identify support and resistance levels. A market is on sale when it is trading near a support level after an extended drop and is at a premium (or too high) when it is trading near resistance after an extended advance.

When you buy near support after a break or sell near resistance after a rally you are "taking a stand". You are telling everyone that you think the market is under priced or over priced. You are telling other speculators that you think they have made a mistake by driving the market too low or too high. This is a valuable contribution to the price discovery process. You also improve market liquidity by taking the opposite side of the market from overeager sellers or buyers. These are valuable economic services that are not provided by trend followers.

So I say you should learn how to take a stand at support or resistance levels. If you provide a real economic service to the market you can expect the market to compensate you for your efforts.

Friday, June 03, 2005


Daily Chart of June 2005 Gold Posted by Hello

Gold and the New York Times

In an editorial this morning the New York Times announced that it wants the IMF to sell about 30% of its gold reserves to help the world's destitute people. A noble sentiment. But is it a good market call?

Of course, if the Times really wanted to help the poor it would want to get as high a price for the IMF's gold as possible. So, if we want to look at this as a market call, I guess we would have to put the Times in the bearish camp.

Now I have found the NY Times invaluable as an opinion indicator (see this post and that one) and generally find it profitable to "fade the Times", i.e. to do the opposite of whatever it is urging or encouraging its readers to do. So the Times' editorial makes me even more bullish on gold than I was in my last post on the subject.

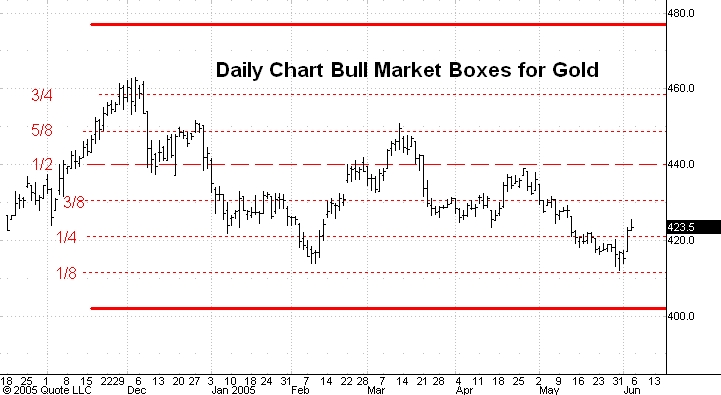
In that post I said that I expected gold to drop to 402, the bottom of its current bull market box and then to rally to 500 or higher. I've updated the box picture in the daily chart above. I no longer think the market will reach 402 and now believe that the low of the reaction which started from the 458 level in December 2004 was made in the June 2005 contract at 412 on May 31.

Gold is going up from here.

Hourly Chart of T-bond Futures Posted by Hello

Hourly Chart of 10 Year Note Futures Posted by Hello

Bonds and 10 Year Notes

In this June 1 post on the bond futures I said that the market would probably move to the 3/4 (at 119-01) or the top of the current box (at 119-12) and then drop by a full box (46 ticks) or so before the upswing from the March low at 109 resumes.

On this morning's employment news the market moved up to the 1/2 point of the next higher box at 119-23 but then dropped sharply by almost a full box in only a couple of hours. I think the bonds will drop to the bottom of the box at 117-30 before another rally can start. This market will move above 120 before any big decline sets in.

The picture in the 10 year notes is similar. The market will find support near 113-14, a level that would make the drop from today's high about a full box (39 ticks) in length. After that level is reached the move to 116 or so should resume.

Thursday, June 02, 2005

Contrary Opinion and the Bond Market

Here's a link to Mark Hulbert's latest column on Money Watch. Mark observes that the bond market timers he follows are now essentially neutral on the market. Back in late March when the bond futures were trading at 109 and the 10 year note futures at 107-26 these same timers were looking for much lower prices and were (as a group) dead wrong in this expectation.

The question now is whether their current neutral position conveys any information about the markets' likely direction over the next couple of months. Mark thinks that it is basically a bullish piece of information and thinks that the timers were show a much more bullish attitude near the top than they do now.

I happen to agree with Mark's prognosis as readers of this blog know. I think the bond futures will get up above 120 and the note futures will reach116 before this upmove turns around. My forecasts are based on purely technical, market based considerations. Still, it is reassuring to see that bullish sentiment has still not taken a firm hold.

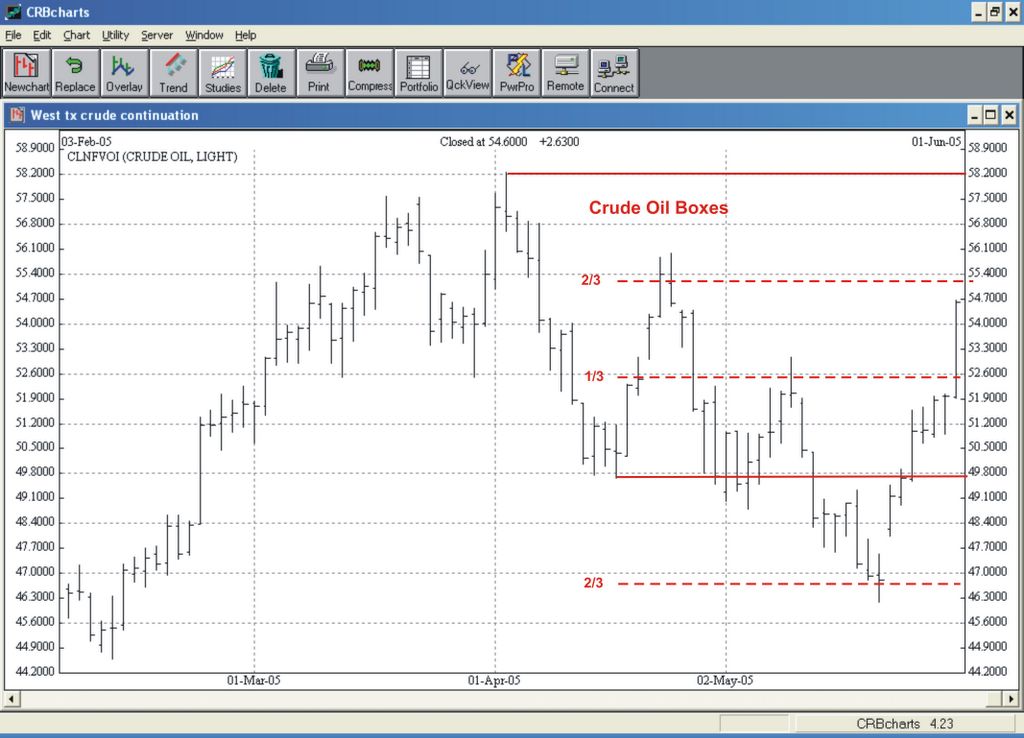
Daily Continuation Chart of Crude Oil Futures Posted by Hello

Crude Oil

Crude oil has rallied about $8 over the past week so I thought I would take a look at the boxes on the daily continuation chart for crude oil futures. I am long term bearish on crude oil and think the market will drop at least to $25 over the next 2 or 3 years.

The initial down leg in crude from 58.20 to 49.66 established a bear market box $8.54 from top to bottom. As rule I find that markets tend to respect the 1/2 and 1/4 division points of boxes as support and resistance levels, but sometimes one finds a situation in which the 1/3 and 2/3 levels are more important. That is the situation is crude oil at the moment.

I've drawn in the box divisions on the daily chart above. You can see that the low at 46.20 prior to the recent rally occurred near the 2/3 point of the second bear market box which stands at 46.81. Normally this would forecast a rally to the 1/3 point of the next higher box, but crude blew right past that level yesterday. I think the market will now stop near the 2/3 point at 55.35 making the rally from the low a full box in length. (Note that a rally of exactly a box would carry to 54.74.) The next big move in crude should be downward towards the $40 level.

Wednesday, June 01, 2005


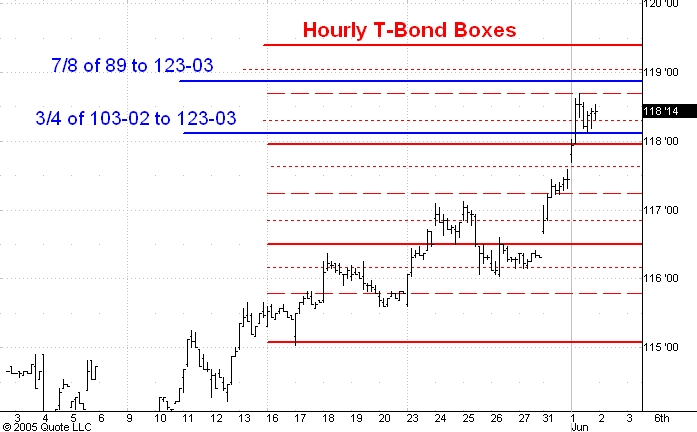
Hourly Chart of Bond Futures at the Close Posted by Hello

Bond Futures on the Close

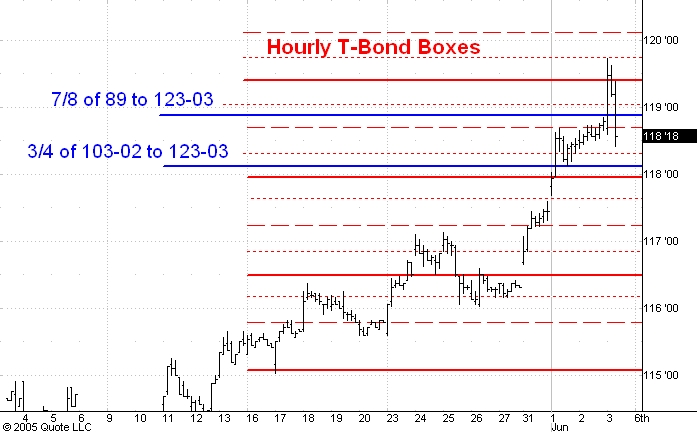
The purchasing manager number sent the September bond futures up past the 117-30 level to the 1/2 point of the next box at 118-21. It looks to me like the reaction from 118-22 will hold support at the bottom of the box (117-30) and that this market will soon move up to either the 3/4 point or the top of its current box.

The bond futures have hit and slightly exceeded two other resistance levels which are drawn in blue in the hourly chart you see above. The first is the 3/4 division point of the range from the June 2003 high at 123-03 to the May 2004 low at 103-02. The second is the 7/8 division point of the range from the January 2000 low at 89 to the June 2003 high at 123-03. These division points are generally strong resistance levels so I think the next reaction will carry the market down at least 2 points, the extent of the biggest reaction so far in the uptrend from the March low at 109.

After that reaction is complete I think the bond futures will move up into the 120-121 zone.

Hourly Chart of T-bonds  Posted by Hello

Hourly Chart of 10 Year Notes Posted by Hello

Bond and Note Boxes

In my May 26 post on the bonds and notes I said that the reaction in the bonds would carry down to 115-25, the 1/2 point of a box and that the reaction in the notes would carry down to 112-06, the 1/2 point of the next lower box. In each case I was expecting a drop of a full box from the preceding high point.

In both cases the market only reacted 3/4 of a box from the high. This is an indication that the uptrend which began from the March 2005 lows of 109 in the bonds and 107-26 in the notes is still strong and intact.

The top of the current box in the notes is at 113-23 while the top of the current box in the bonds is at 117-30. I think it likely that another brief reaction will start from these levels and will carry each market down 3/4 to a full box.

Daily Chart of Eurocurrency Futures Posted by Hello

Eurocurrency Will Rally

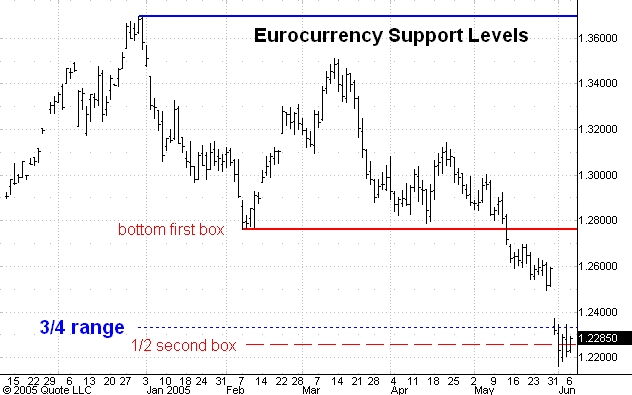
The daily chart above shows that the June Eurocurrency futures have reached the 1/2 point of the second bear market box which stands at 122.12. Moreover the market has dropped a bit below 123.34, the 3/4 point of its historical range of 82.73 to 136.87. (A note on the chart: the bar which should record the range for Tuesday, May 31 is missing!)

The rejection of the EU treaty by the French sent the market down sharply and important lows are usually associated with bad news. My conclusion is that the Eurocurrency is about to rally several hundred points.

At this juncture I think the best thing to do is wait for the market to trade sideways for three or four days at current levels and then to take long positions as close to these support lines as possible.