Real Time e-mini S&P Trading, plus contrarian commentary on all the markets, all the time
Thursday, June 30, 2005
NYSE Advancing Issues
Nowadays I don't use oscillators to evaluate the market's condition. But when I first started doing technical analysis 40 years ago I put a great deal of emphasis on the 10 day moving average of the number of advancing issues on the New York Stock Exchange. Over the years it has proven its value and it is the only oscillator I look at. I should say too that I find the daily numbers themselves even more valuable.
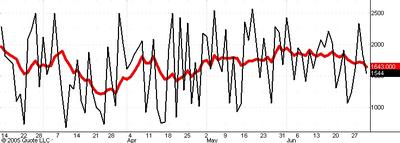
The chart above shows the daily count (in black) of the number of advancing issues on the NYSE and the 10 day moving average of these numbers (in red).
You can see that while today the S&P dropped quite close to Monday's low there were about 500 more advancing issues than there were on Monday. This together with the fact that Tuesday's number was the highest in almost a month and higher than several of the preceeding daily peaks is evidence that Monday's low will hold.
The 10 day moving average is well above its April lows, again suggesting that the drop from 1225 is only corrective. Note how this moving average was significantly higher at the April 18 low than it was in late March on the way down to that low. Such divergences at lows in a bull market are usually very significant.
S&P
I think that the September S&P futures are about to turn upwards and run up to the 1245, the 1/2 point of the next box. The hourly chart above shows that the reaction which started from the 1225.20 level stopped just shy of the 1191.90 where it would have equalled the biggest break in the uptrend from 1135.80.
If I am wrong in this assesment then I think the market will drop to the bottom of the box near 1180 and then rally to 1245.
Guesstimates on June 30, 8:50 am ET
S&P: Still think that a slight break below 1190 is likely but then market will move to new highs for the year.
Bonds: the market should now drop to 117-00 or so.
10 Year Notes: the notes will soon drop at least to 112-26.
Eurocurrency: Support is still 120.60 and the market is on its way to 124.00.
August Crude: nearthe bottom of the box near 56.50 and should now rally to 62.00.
Gold: 436.50 is the 1/2 point of the box and from there the market should moveup to 449.
Google: the next 40 point move will be downward. Support is at 270.
Wednesday, June 29, 2005
Eurocurrency
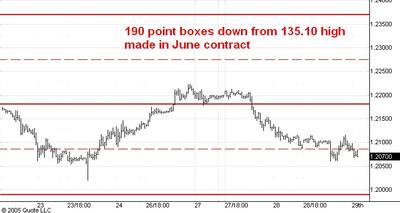
The 1.90 point boxes down from the 135.10 high are shown on the hourly chart of the September eurocurrency futures you see above. I think that the 120.60 level will hold but if I am wrong about this the worst I see on the downside is 119.90, the bottom of the current box. In either case the market should then head up to 124.00.
Gold
Crude Oil
Guesstimates on June 29. 8:35 am ET
S&P: Still think that a slight break below 1190 is likely but then market will move to new highs for the year.
Bonds: the market should now drop to 117-00 or so.
10 Year Notes: the notes will soon drop below 113 again.
Eurocurrency: Support is still 120.60 and the market is on its way to 124.00.
August Crude: will now drop to the bottom of the box near 56.50 and then rally to 62.00.
Gold: 436.50 is the 1/2 point of the box and from there the market should moveup to 449.
Google: the next 40 point move will be downward. Support is at 265.
Tuesday, June 28, 2005
Headed Up?
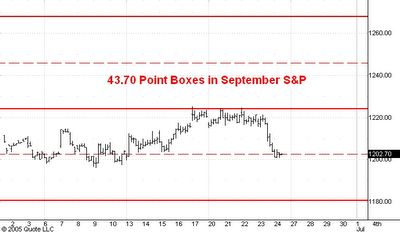
I want to take another look at the September S&P futures. The hourly chart above shows the 43.70 point boxes for the uptrend from the April daytime low (in the June contract) at 1136.80.
I have been thinking that 1193 would be support based on the fact that at 1191.90 the market would have duplicated the biggest reaction in the uptrend thus far. The question is: have we seen the reaction low?
My guess is that the market will take a stab at the 1190 level but won't break it by much. The best time for such a "false breakout" would be after the Fed announcement at 2:15 pm ET on Thursday.
Meantime the 1204 level represents a 1/4 box rally from the low (thus far) of 1192.50. A close today visibly above that level (say at 1207 or higher) would convince me that my expectation of a break below 1192.50 won't be fulfilled and that the market has already started its move above 1230.
Crude Oil
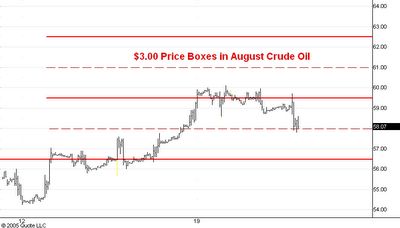
The hourly chart above shows the $3.oo price boxes in August West Texas crude oil. Normally reactions in an uptrend carry the market down 1/2 a box or a full box. But a full box reaction from 61.00 resistance would go all the way down to the last low. This would violate the staircase principle. So I think the current reaction will be about as big as the last one, $2.30. This is 3/4 of a box and would end at a higher low. Then the market should move above the 61.00 level.
Remember that this bull market is likely to end in the 62-63 range so upside potential is quite limited.
So This Is a Weak Economy?
Check out Davis Malpass’s column on the editorial page of today’s Wall Street Journal. (Here is the link but you may have to be a subscriber to get access!). His piece is entitled “So This Is a Weak Economy?”
As you can guess his thesis is that people are consistently underestimating the strength of the U.S. economy and bad-mouthing U.S. economic prospects. I happen to agree with his observation but what really interested me were the following paragraphs:
“Yet the litany against the U.S. economy is so ingrained and familiar that few disputed this spring’s ‘slowdown.’ When strong [economic performance] continued into the second quarter, the headlines shifted to other attacks - adjustable-rate mortgages, a housing ‘bubble’, the distribution of income - rather than revising the slowdown story.”
“Why the urge to look for weakness at every turn? Partly , bad news sells; even in business news, if it bleeds, it leads. Second, some of the search for weakness is pure politics - the party in the opposition has an interest in criticizing the economy….”
To me this is just more confirmation of my own observation that the press and the public are generally negative towards U.S. economic performance and prospects. It is almost inconceivable that a bull market in stocks could end in such an environment.
Guesstimates on June 28, 8:15 am ET
S&P: support at 1193 should hold but if it doesn't then market will drop to 1183. After that a move to new highs for the year will begin.
Bonds: 119-10 is resistance and the market should now drop to 117-00 or so.
10 Year Notes: 114-06 is resistance and the notes will soon drop below 113 again.
Eurocurrency: Support is 120.60 and the market is on its way to 124.00.
August Crude: headed for 62.00 with support at 58.40 and resistance at 61.00.
Gold: 438 is now support and gold appears likely to hit 449 before another small reaction starts.
Google: has reached the 304-305 target zone. Will probably trade a few points higher todaybut the next 40 point move will be downward.
Monday, June 27, 2005
Crude Oil
The hourly chart of August West Texas crude oil above shows the short term boxes for the trend up from the May 20 low. The market has just hit the 1/2 point of a box at 61.00 but on past form I would expect it to go a bit above this level before reacting. In any case the 61.00 to 61.50 zone should prove to be strong short term resistance and a break of at least 1/2 a box from there is my expectation.
Bonds and 10 Year Notes
I think the next multi-point move in the bonds and notes will be downward towards the low at 115-26 in the bonds and 112-04 in the notes.
As you can see in the hourly bond chart above the September futures have nearly reached the 119-10 level which is the top of the third box in the uptrend from 115-26. I think the market will react down to the top of the first box near 117-00.
The hourly chart of the September 10 year note futures above shows that the market is stalling at the top of the third box up from the 112-04 low. I think the next move will be downward to the top of the first box near 112-24.
The Fed Plays the Expectations Game
In a previous post I pointed out that the Fed under Greenspan’s direction has tried to be as predictable as possible. This observation can be useful in surprising ways.
This past weekend views on likely Fed policy have started to crystallize. Bill Gross, PIMCO’s founder, is an opinion leader in the bond market. He is quoted in this week’s Barron’s Current Yield column as saying that the Fed will raise the funds rate another 50 basis points to 3.50% and then start to lower rates later this year. (Funds currently trade at 3.00% and the Fed is widely expected to push this up to 3.25% this week.) Other commentators are starting to join this chorus as this week's cover story in Barron's also suggests.
I think this means that the bond market’s expectation is moving in the direction of a Fed mid-year pause in its moves towards higher rates. Moreover, the sideways action of the stock market during the past 18 months certainly will cause the Fed some worry about the strength of the economic recovery and thus encourage such a pause.
Since the market’s expectation of a mid-year Fed pause is growing, such a pause is becoming more and more likely. After all, the Fed wants to be predictable and I conclude from this that it is encouraging this change in expectation.
Finally, I should point out that my 2005 bond market forecast predicted just such a pause (starting in May 2005) base solely on George Lindsay inspired analysis of time periods between major interest rate extremes.
Guesstimates on June 27, 8:25 am ET
S&P: support at 1193 should hold but if it doesn't then market will drop to 1183. After that a move to new highs for the year will begin.
Bonds: It looks like the bonds will rally close to the top of the box at 119-10 before dropping a couple of points again.
10 Year Notes: 114-06 is resistance and once it is reached the notes will drop below 113 again.
Eurocurrency: Support is 120.60 and the market is on its way to 124.00.
August Crude: headed for 62.00 with support at 58.40 and resistance at 61.00.
Gold: 438 is now support and gold appears likely to hit 449 before another small reaction starts.
Google: should rally to 304-305.
Sunday, June 26, 2005
Laughing at Google
Check out this column in the latest issue of Business Week. Bob Barker admits he thought GOOG was trash at $85 and now thinks it is 3 1/2 times trashier at $295. I enjoy his humor but I don't think we'll see the top in Google until people are too embarrassed to write these sorts of columns.
The Big Picture on June 26, 2005
It is easy to loose sight of the longer term prospects for a market when you are paying so much attention to shorter term fluctuations. Here are some educated guesses about longer term trends in markets that interest me.
S&P - Headed for 1350 by the end of 2005, then down 20-25% in 2006.
Bonds - up into 120-122 range over the next few months then down to 100 by late 2006.
10 Year Notes - up to 116 over the next few months then down to 104 by late 2006.
3-month Eurodollars - will reach 4.85% by the end of 2006. Gold - up to 510 before the bull market ends.
Crude Oil ? I am now looking for the big top in the $60-63 range. Then down to $ 27 over the next two years.
US Dollar index- Should react from 89-90 down to 84-85. Then up to 100 over the next year and to 121 by 2010
Eurocurrency ? Should rally from 120.60 to 126 or so then down to 107 over the next year and to 80 by 2010
Google - up to 376 by the end of 2005
IBM - up to 108 by the end of 2005
Microsoft - up to 42 by the end of 2005
Saturday, June 25, 2005
Just Another S&P Reaction?
As you know I am very bullish on stocks and in particular on the stock indexes. I am predicting that the S&P 500 will reach the 1350 level by the end of the year.
So far the drop from the June 20 top at 1225.20 in the September S&P futures has carried the market down more than 30 points, quite a bit farther than I was expecting. This begs the question of whether or not the uptrend from the April low at 1135.80 (overnight) has ended and if so how much lower the average might go.
My box theory says that reactions within an ongoing trend are usually only ½ a box in extent but can be as big as a full box. Anything more than a full box reaction casts doubt on the trend direction.
Another yardstick I find useful is the length of the biggest reaction within the trend thus far. A reaction that is bigger than this also casts doubt on the presumed trend direction.
In the case of the S&P futures, I am working with price boxes up from 1136.80 (the daytime low) that are 43.70 points high. The market hit the top of the second box in the uptrend at 1224.20 and could go as low as the bottom of the second box at 1180.50 without negating the box theory evidence for this uptrend.
The biggest reaction in the trend so far carried from 1180.50 (daytime high) on May 9 to 1147.20 on May 13, a total of 33.30 points. A reaction that big from the 1225.20 high would end at 1191.90. My experience tells me that the 1191.90 level is more likely to mark the low of this reaction than is the 1180.50 level. It also coincides with the ¼ division point of the second box.
Friday, June 24, 2005
Gold
August Gold didn't make it to my short term 449 target before a good reaction began. I estimate that this break will carry the market down $6 to $7, about 1/2 a box from the high at 445.40.
S&P
I think the S&P's will hold the 1/2 point of the box you see in the hourly chart above and then rally to 1248. If I'm wrong and the market starts to spend time below 1201 then the next stop will be the top of the first box at 1180.
Bonds and Notes
It now appears that the bonds and notes won't reach the targets I cited in this morning's guesstimate.
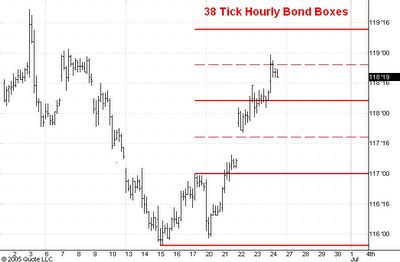
The hourly chart of the bonds shows that the market has stalled at the 1/2 point of a box after a burst upward on news this morning that had no follow-through. It looks like the market is now headed down at least to the top of the first box at 117-00. I do expect the 115-26 low to hold.
The notes have stalled near the top of a box and are now headed downward. They should drop at least to 112-24 but I think the 112-05 low will hold.
IBM
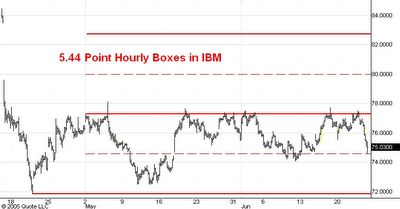
The hourly chart above this post shows price boxes in IBM. As you know I think IBM is headed for 106 by the end of the year. Shorter term I am expecting IBM to hold support near 74.50, the 1/2 point of the first box and then move to 80.00, the 1/2 point of the second box.
Guesstimates on June 24, 8:30 am ET
S&P: Should hold support at 1203 (at 8:55 I noticed that I had typed 1213 instead of 1203 and so corrected the mistake) and then rally to 1248.
Bonds: There is still resistance at 118-22 but I think the bonds will rally close to the top of the box at 119-10 before dropping a couple of points again.
10 Year Notes: 114-06 is resistance and once it is reached the notes will drop below 113 again.
Eurocurrency: Support is 120.60 and from there the market should rally to 124.00.
August Crude: headed for 62.00 with support at 58.40 and resistance at 61.00.
Gold: moving up from the 1/2 point of the box at 436 to 449.
Google: should rally to 304-305.
Thursday, June 23, 2005
Revised S&P Boxes
The break below 1214 support convinced me to revise the position of the S&P boxes that I am using to measure the uptrend from the April daytime low in the June S&P at 1136.80. I now think these boxes are 43.70 points high with the top of the first box at 1180.50, the daytime high on May 6 of the first rally off the low.
The top of the second box is 1224.20 while the 1/2 point of this box is 1202.30. I think the current break will find support in the 1202-1205 zone and that the next upmove will carry the market above 1230.
Googlestimate
I've been guesstimating that Google is on its way into the 308-312 range over the next couple of weeks. But a closer look at the price boxes which have developed since the low at 267.43 warrants a slight revision of this projection.
The boxes on the way up from 267.43 are drawn in black and are $12.72 high. The top of the third box is at 305.59. The bull market boxes in GOOG are drawn in red and are $40 high. The midpoint of one of these boxes is at 302 while a rally from 267.43 that is a full box in extent would then carry to 307.43.
So I am guessing that the midpoint of the 302-307.43 range, namely 304.71, is the best short term target for this rally.
I still think that by the end of 2005 Google will have reached the 376 level.
Bonds
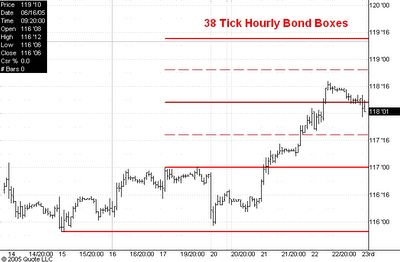
The hourly chart above shows the 38 tick bond boxes in the uptrend from 115-26. I am now guessing that the market will hold the 117-25 level. This is just an average which I calculated by observing that a reaction that dropped below 118-08 would either be 1/2 a box in lenth and thus be 19 ticks and stop at 118-00, or would go to 117-18, the 1/2 point of the next lower box. The average of these two levels is 117-25.
Eurocurrency
The September eurocurrency futures have reached support and should now start a rally to 124.00 and higher.
Guesstimates on June 23, 8:30 am ET
S&P: headed up to 1242 and won't go to 1214 first.
Bonds: Resistance at 118-22 today and support is at 118-06. (Added at 9:00 am: whoops! support is now at 117-26). The market will probably move above 119-00 and then drop below 117 again.
10 Year Notes: 113-24 is resistance today and support is at 113-08 but the market will probably move to 114-06 before dropping below 113 again.
Eurocurrency: Support is 120.60 and from there the market should rally to 124.00.
August Crude: headed for 62.00 with support at 58.40.
Gold: has reacted to 1/2 point of the box at 436 and now should rally to 449.
Google: should rally into the 308-312 range.
Wednesday, June 22, 2005
Crude Oil
The August futures have dropped to the 1/2 point of a price box. This is a normal reaction and I think it likely that the market will hold this level. If I am wrong then the worst we should see is a drop to the bottom of the box near 56.50.
Bonds and 10Year Notes
The charts above show my updated estimates of the hourly price boxes for the t-bond and 10 year notes futures.
The boxes in the bonds are 38 ticks high. Today the market has reached resistance at the top of the second box and a reaction of 1/2 box or even 1 box would be normal. However I think the market will reach the 1/2 point of the next box up at 118-25 before it drops below 117 again.
Remember that the intermediate term trend is still upward and that this market is likely to make it into the 121-122 range by the end of the summer.
The boxes in the notes are 20 ticks high. This market has been a bit stronger than I expected as the curve has steepened today. I think it will pause near 113-22, the 1/2 point of the next box and then react 1/2 box or 1 box before resuming a move to 114-00 or 114-10. By the end of the summer I think the 10 year notes will have made it pretty close to 116.
Eurocurrency
The hourly boxes for the September eurocurrency futures show support at 120.80 and 120.59 (the low so far since the December 31 top). I think the market will hold this support and then rally to 124.00 and eventually 126.00.
Guesstimates on June 22, 8:15 am ET
S&P: headed up to 1242 and won't go to 1214 first.
Bonds: 117-24 was too conservative an upside target and 118-06 is now today's likely high. It is the top of the second 38 tick box up from 115-26.
10 Year Notes: 113-10 is resistance today.
Eurocurrency: Support is 120.60 and from there the market should rally to 124.00.
August Crude: headed for 62.00 with resistance today at 61.00 and support at 58.40.
Gold: has reacted to 1/2 point of the box at 436 and now should rally to 449.
Google: should rally into the 308-312 range.
Tuesday, June 21, 2005
Hourly S&P
Above you see the 30 point boxes in an hourly chart of the September S&P futures.
I think the market will drop into the 1212-1214 zone, near the 1/2 division point of the current box and then rally close to 1242, the 1/2 division point of the next higher box.
Eurocurrency boxes
Here is an hourly chart of the September eurocurrency futures. It shows the hourly price boxes that I am using in my short term guesses about the eurocurrency trends.
Eurodollars
The daily chart you see above shows the bear market boxes in the Eurodollar contract. These boxes are 48 ticks high and started from the 2003 high at 99.09 in the December 2003 contract.
I still think the market has a good shot at 96.45, the 1/2 point of the next higher box. This would correspond to a situation in which the markets believed the Fed would pause in its move toward higher short term rates. I think such a pause will occur this summer and early fall.
Hourly Gold Boxes
Here is an hourly chart of August gold showing the overnight action and the $13.70 price boxes that I am using to make guesstimates of its likely price action.
Hourly Crude Oil Boxes
I've been having a hard time with crude oil lately. Here is an hourly chart of August West Texas crude showing the market's position in its hourly price boxes which are $3.00 high. I think the market will eventually make it into the 62.50-63.00 range and meantime reactions should be no more that 1/2 box ($1.50) from high to low.
Guesstimates for June 21, 8:55 am ET
S&P: 1214 is still good support and the S&P should head higher from there.
Bonds: support is at the bottom of the box at 115-27 and the next step up should carry the market to the top of the box at 117-24.
10 Year Notes: support is at the bottom of the box at 111-31 and the next step up should carry to 113-10.
Eurocurrency: Support is 120.60 and from there the market should rally to 124.00.
August Crude: headed for 62.00 with resistance today at 61.00 and support at 58.40.
Gold: has reacted overnight to the 1/2 point of the box at 436 and now should rally to 449.
Google: 278 is now support for any reaction from 289. GOOG should next rally into the 308-312 range.
Subscribe to:
Posts (Atom)