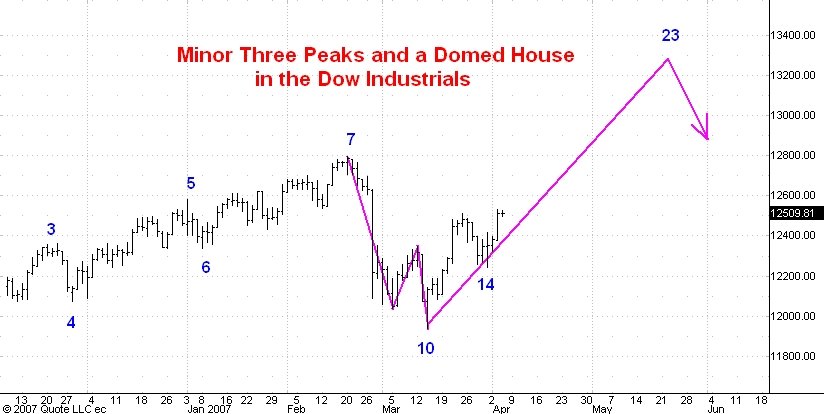

Above this post you will see two daily bar charts of the Dow Industrial average. I have labeled the first chart to show what I think are the turning points in the current domed house portion of George Lindsay's Three Peaks and a Domed House formation. I last commented on this here. I have labeled the second chart to show the turning points of a minor Three Peaks and a Domed house formation which I think began last November. I last commented on this minor formation here.
I think we have seen points 10 and 14 in the minor formation (blue numbering on second chart above). The prognosis is for a move to new bull market highs. I think blue point 23 will develop near Dow 13300.
In the major formation (first chart, red numbering) point 22 occurred on March 14 and the market is now in its rally to point 23. This will coincide with blue point 23 near the Dow 13300 level.
In a previous post I suggested that May 17 is a likely date for a top based on calculations using Lindsay's theory of basic advances and declines. This is still my best guess for the timing of point 23.
1 comment:
Hi Carl
Do you distinguish between the 40WK cycle and the 9MTH or do you see them as one?
TIA
Post a Comment