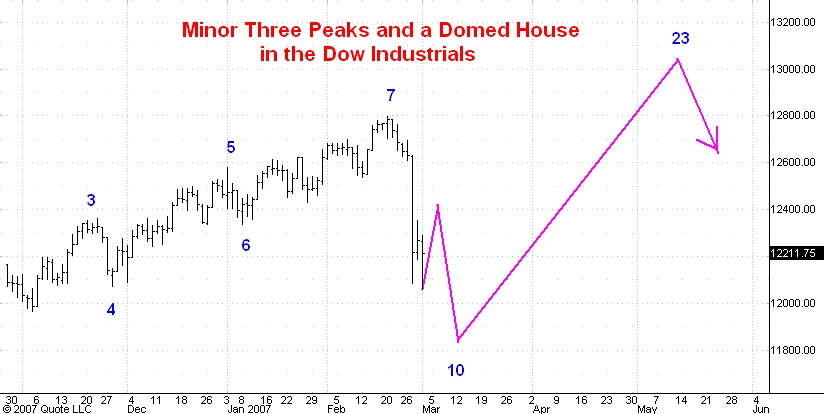
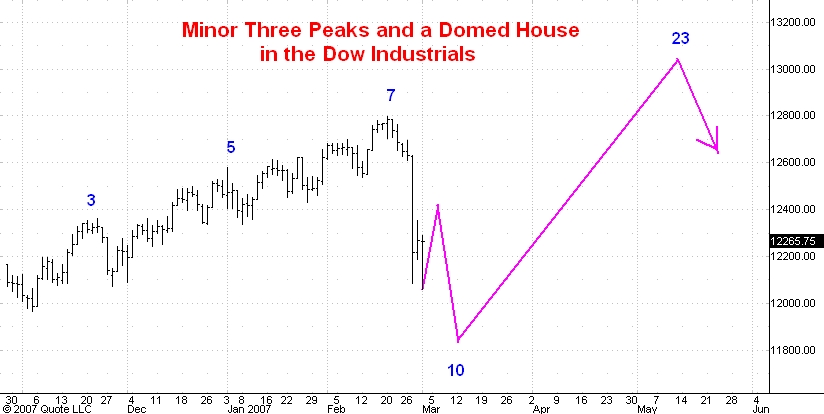
Here is a daily chart of the Dow Industrials. On it I have marked the turning points of what I believe is a developing minor version of George Lindsay's Three Peaks and a Domed House formation. I last commented on the developing major formation here. The difference between a major and a minor formation is that in a major formation the first and third peaks are separated by at least 6 months but by less than 12 months. In a minor formation the separation between the first and third peaks is generally much less than 6 months, usually only 2 to 4 months.
The reason to be on the lookout for minor formations is that they tell you that new bull market highs can be expected down the road a bit. In the current situation the first peak, point 3, formed last November, while the third peak, point 7, was last week's high. The separation in this case was almost exactly three months, typical of a minor formation.
This morning's low in the Dow took out the low at point 4 and in doing so more than qualified as a complete, separating decline. However, I do not think this morning's low was point 10 itself. Instead I am guessing that after a rally of a few days the Dow will make new lows for the reaction and that point 10 will develop near 11800.
Once the point 10 low occurs the expectation is for a Domed House rally to new bull market highs followed by a drop which will take the market below point 10. I think the new high will occur near the Dow 13000. I am becoming more convinced that this high will also be point 23 of the major formation. This makes it very likely that the major formation's high will be in April or even in May.
7 comments:
"I think the new high will occur near the Dow 1300." It had better be Dow 13000...Thirteen THOUSAND.
Thanks for the correction.
Great work Carl, once again. The cover page of this week's The Economist is interesting - http://www.economist.com/printedition/
CARL
there is a pretty solid case to be made tha we are in a weekly point 22 that is within a monthly point 23 . tis is what ihave been looking for for a few years now .
right now there is still alot of bullishness in this market which concerns me that we might be in for a larger decline into june or july , you touched on this last year andi tend to agree with it .
either way my work still pin points on next week . weather up or down. lastly i still have to count the larger 3 peaks domed house pattern as begining in 1997 .
to add to this here is someting of a specualtive comparison .
march 26 1929 stock drop big and the exchanges see record volume on shares traded , april 1 1929 stcoks drop big again .
feb 27 2007 stocks drop big as exchanges see record volume on shares traded . march 1 2007 stocks fall big again .
sept 3 1929 stocks reac record highs and some stock tripled fromn year ao prices . so we back this up 1 month . aug 3rd 2007 ???
just something to think of
as for the overall market we are following the pattern of previous crashes vey closely . we must respect the 7 month 10 days from point 10 low in july 2006 .
im bearish and hedged . the next major cycle turn in my work is
july 22 nd 2007 . so that augest 3rd comparitive has some interesting comparisons .
lastly my cycles work turned down
feb 2nd and feb 16th and point lower into july 22 2007 . if we follow the the previous crash style patterns we wont see any meaningful bounce for a while .
so im open minded to both sides of this market and have my self positioned for both sides as i
next week is where the rubber meets the road . if you listened to cnbc today you cold tell they were already declaring the bottom in place before the market even closed . this is not what we should be seeing at a bottom of importance. so we are not out of the woods with te bullish case nor
has the bearish case been invalidated . and lastly point 20
from you daily chart has been vilolated which implies we are in the larger weekly or monthly 3 peakes domed house pattern .
everything for this year is pin pointed at next week short term
and july 22 to aug 3rd for the year for a longer term perspective .
this market has very little time to prove itself bullish and to top it off it is following previous crash patterns very very closely .
take the time to plot 1987 or 1929
and figure todays market into it .
we are following those patterns very closely right now . and with the presant denial of this pullback
being anything more then a buying opurtunity we have to say that this is a very very dangerous market . it is not the time to assume that we have another leg up
even if it was to happen .it would be the very last leg . either way we live in dangerous times
Carl,
IF possible, would appreciate an update of NYX. Its dropped more than your projection, yet the uptrend is not necessarily dead - not sure what this does for the upside projection, though, by your work, since the box size is now larger.
Thanks!
thank you very much for such updates. I am in the Far East, Singapore and 3PDH really excites me as it is never easy to follow! Where can I get the number of days count for the 3PDH as a sideline I like to time it on my local stock market index? If I use Feb 26th as top and start date of Jul 17th 2006 I get 7M10D. But this is cheating!
A domed house that fits with you other analysis ... interesting. I guess we'll see. In other news: Can I submit Paul Krugman for the contrary list? http://economistsview.typepad.com/economistsview/2007/03/paul_krugman_th.html
Post a Comment