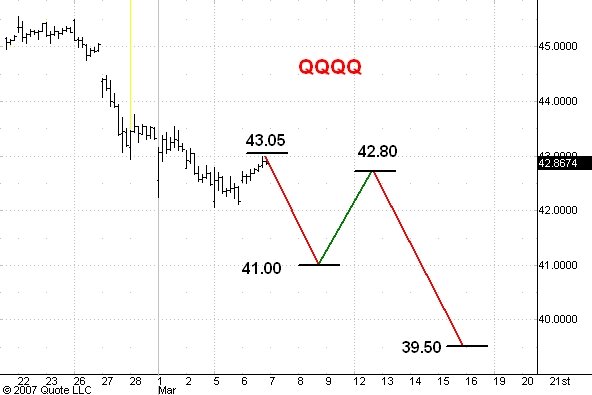

Here are hourly charts of the Spiders and the QQQQ's. The chart for the March S&P looks very similar to the Spider chart if you first multiply the Spider price by 10. I last commented on these markets here.
Today's rally has just about equalled the biggest rally so far during the drop from the February 22 top. I think the next swing will be downward to roughly 136.30 in the Spiders and to 41.00 in the Q's. Then I shall expect the biggest rally of the correction thus far to carry the Spiders up to 141.10 or so and the Q's to 42.80.
After that big rally the third phase of the correction is likely to begin. My downside targets for the end of the correction are 135 in the Spiders and 39.50 in the Q's.
2 comments:
Carl,
I have been a student of the markets for 25 years.
Finding your work available on the inernet was such a pleasent
surprise.
Serendipituosly, I have worked on something similar to your
box/step analysis.
I find your work fascinating and want to thank you for
the great job that you are doing.
My work is pointing (at this point) at a SP 1357-1359 bottom
after a bounce to 1404 or possibly 1409. I "optomize" inervals
(steps) by minimizing daily HI/Lo-to-Interval error over a period of time.
Put/call (21-day CBOE approching .70 and ISE near 100) support a quick
rally, and is compatible with your call topping in April/May.
Thanks Carl, but you kept pushing your targets up on the S&P to 1450-60-then 70. Your work seems to be reactionary rather than anticipatory. Last tuesday morning when the futures were down over 100 DOW points and all the other markets had cracked, you were still expecting a move to 1470. Why didn't you give more credence to pre-market futures activity?
Post a Comment