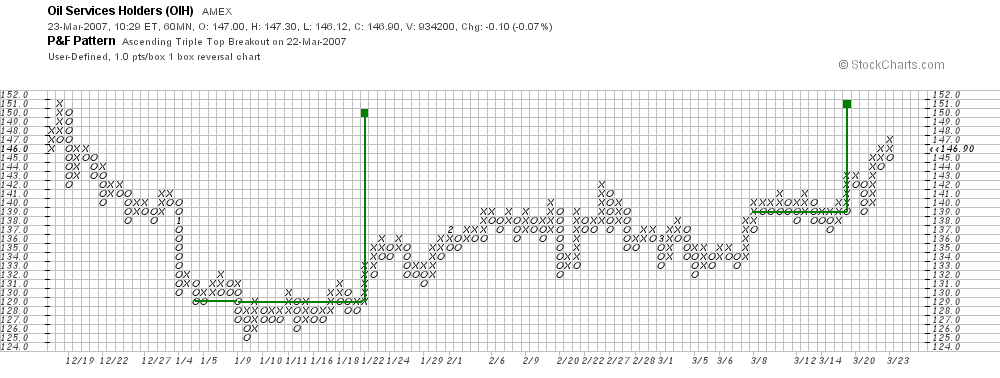
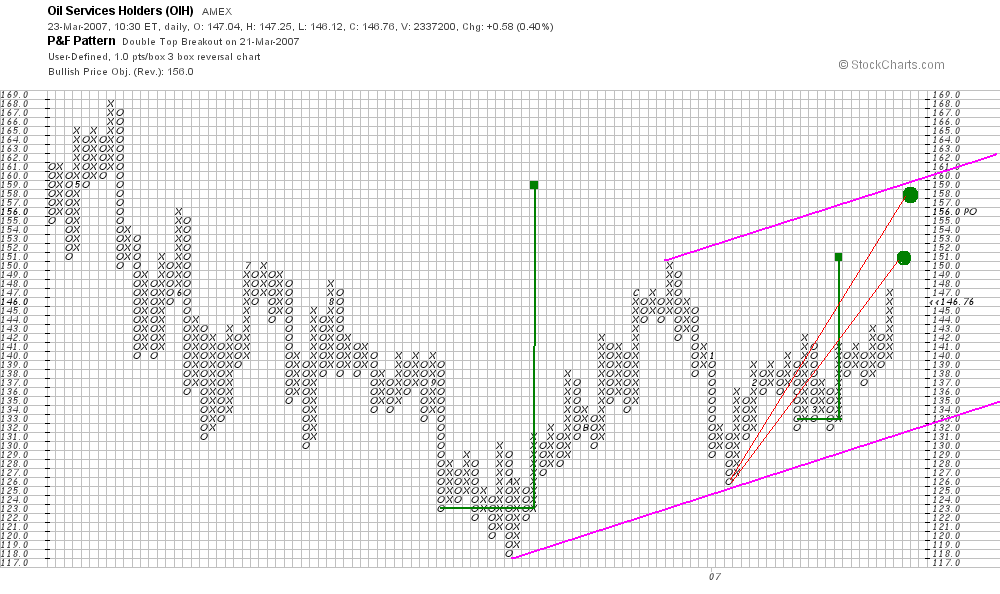
 Here are two point and figure charts of the Oil Service HOLDRS. The first is a three box reversal chart while the second is a one box reversal chart. On each the box size is one point. I last commented on this market here.
 I had thought that the congestion area in the 138-40 zone heralded a substantial drop but I was wrong about that. However I still think that OIH will drop below 120 before it goes above 160.
Looking at the point and figure counts on these charts highlights two possible upside targets. The more conservative one is 151 which would equal last December's high. Since I think OIH is in a bear market this is the target with which I am most confortable.
However, there is some evidence that the market will carry OIH higher to 159 or so. There is a 12 column congestion area around last October's low across the 123 price line. Since this is a three box reversal chart this count indicates a potential advance of 3 x 12 or 36 points on top of 123, i.e. and advance to 159. Note also the parallel trend channel I have drawn on the 3 box reversal chart. If the market continues the current pace of its advance it would hit the top of the channel roughly near 159.
No comments:
Post a Comment