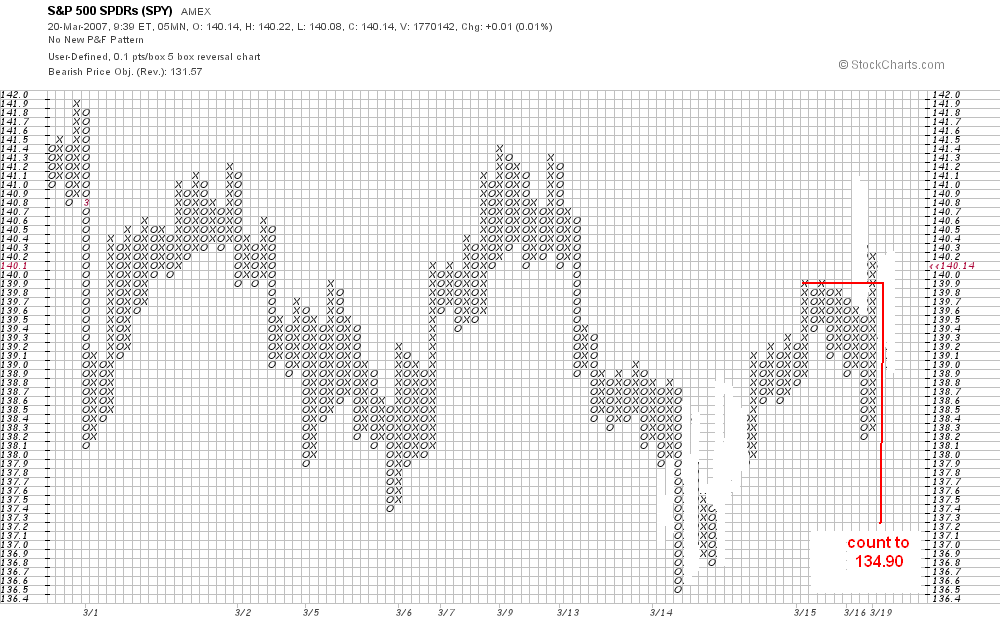
Here is a 5 box reversal point and figure chart for the Spiders. The box size is 0.10 points and I have edited out the effects of bad ticks ( at the expense of some apparent empty columns in the chart). I last commented on this market here.
The think that strikes me about this chart is that the rally from the March 15 low at 136.75 has at the moment run out of steam. There is an obvious congestion area at the top of this rally. If the market turns down from current levels this congestion area will measure 10 columns in width. Since this is a 5 box reversal chart the downside count objective would be 50 boxes (5 points) lower at 134.90, in pretty good agreement with my 135.00 objective for this entire correction.
Note that there was little congestion at the March 15 low and that the congestion over the past couple of days is as big as that at the tops of the previous two rallies. I think this means that the Spiders (and S&P's ) are about to turn lower and move to the 135.00 target (1360 in the S&P's).
2 comments:
Hello Carl,
I think we are going up to 1420 before we head lower. I think the 1420 area will come in on Wed or Thurs and head down to the 1350 area by march end early April.
chitown
Carl, thanks for the chart lesson and the box count explanation. Is congestion primarliy indicated by a series of double or triple tops and a sideways moving market?
Also, perhaps you can give a lesson on how you configure the chart settings on stockCharts.com. I go to that site, but would like to know more on how to properly configure the charts to show the right data. Thank you again for the excellent work on this blog!
Post a Comment