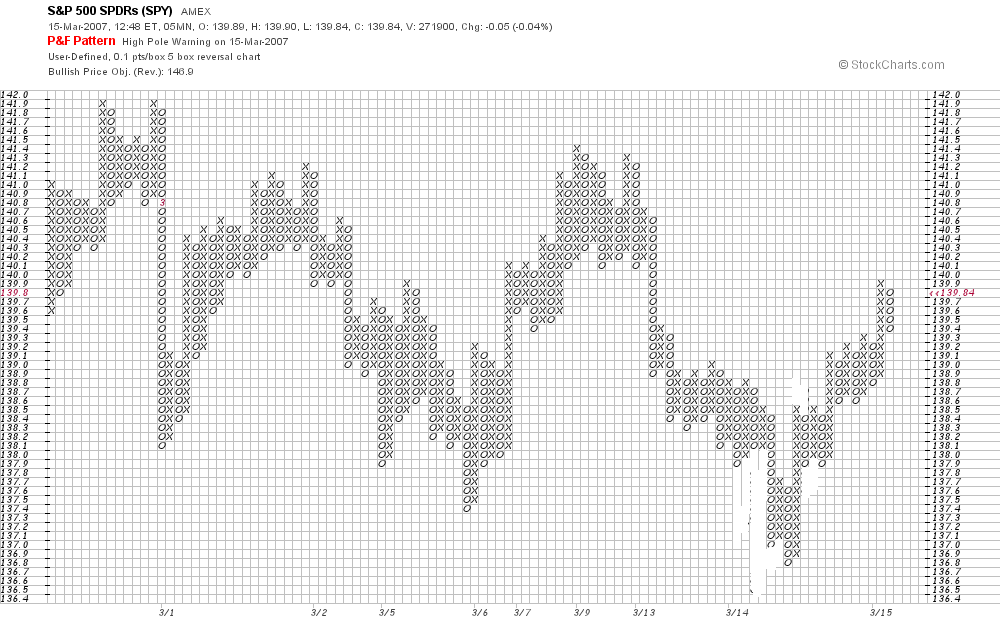
Here is a 5 box reversal chart for the Spiders with a box size of 0.10 points which comes to us courtesy of StockCharts.com. I last commented on this market here.
Unfortunately, Spider data is beset by many "bad ticks" which affect the quality of StockCharts.com 's point and figure charts. On this chart I have edited out the effects of several bad ticks so the action during the past two days will look a little different from that which appears on StockChart's own version of this chart.
You can see that the market is now about in the middle of the trading range which began on March 1. Markets rarely stop a swing in the middle of trading ranges so I expect to see the Spiders trade up to the high near 141.42 over the next couple of days.
I want to bring your attention to the relative sizes of the congestion areas near yesterday's low and near the high at 141.42 which preceeded that low. Note that there was very little congestion (i.e. sideways action) near the low while there was quite a bit of congestion near the preceeding high. This tells me that the market is likely to break below yesterday's low sometime during the next week or two and that is it unlikely that it will even get as high as 141.42 in the interim.
My downside target for the Spiders for the entire correction remains 135.00.
If you trade the S&P's you can multiply the Spider prices by 10 and then add 8 points to get the corresponding prices for the June S&P futures.
1 comment:
It's been six months since you posted any details or charts for the euro/$; perhaps it is time for an update??
john walker
Post a Comment