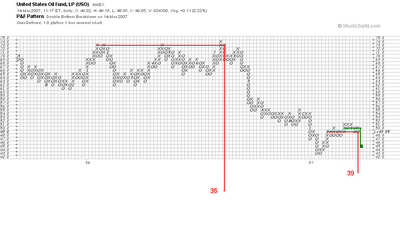
Here is a 1 box reversal chart of the US Oil Fund ETF. I last commented on USO here.
Last year's January - July top in USO was only part of a much bigger top/congestion area centered at the 70 level. Even so, all by itself it projects a low at 35 which would correspond to a price of crude oil in the mid 40's as opposed to 58.00 today. For this and other reasons I think that the bear market in crude oil has not yet ended.
Now look at the price action since the recent low a little above the 42 level. Notice how small was the congestion area near the low and how much bigger is the congestion area near the recent high at 51. Note to that this latter high congestion area is still visibly below the last congestion area on the way down from 74, thus giving further evidence that the longer term trend is downward.
Given the size of the congestion are near 51 it would be resonable to predict and imminent downside breakout below 42 (red count). But corrections in a bear market typically have three phases and so far it looks to me that we have only see the first, upward phase. So for the time beging I am going with the more conservative downside count (shown in green) which calls for a higher low near 45 and then a third phase rally.
2 comments:
hi carl:
wondering if you think whetehr this intraday reversal has marked the bottom in the market? thanks
Good TA analysis.
If oil fall to US$45, is that the reason why you think Gold will also fall to well below $600?
Look forward to an in-depth analysis of gold also, and what is the down-side target.
Based on Fib support, it could be in the $530 or $488 areas.
Post a Comment