

Here are hourly charts of the June S&P futures, the Spiders, and the QQQQ's. I last commented on these markets here.
In this morning's guesstimate I said that a 10-20 point rally would be likely in the S&P from the 1375-80 zone and a 1 - 2 point rally in the Spiders would be likely from the 136.50 - 137.00 zone. So far the rally in both markets has been a little bigger than the upper end of the ranges I cited.
I really can't tell if the next move of 10 to 20 points in the S&P's will be upward from here or instead downward. At the moment I lean slightly toward the view that both market's will drop down close to this morning's low. If this happens I shall have to guess whether the market will continue to its ultimate downside target or instead reverse and head back close to the 1424 high in the futures and the 141.42 high in the Spiders.
However, I am still confident that before the smoke clears and the correction from the late February highs ends we shall see the futures at 1360 and the Spiders at 135.
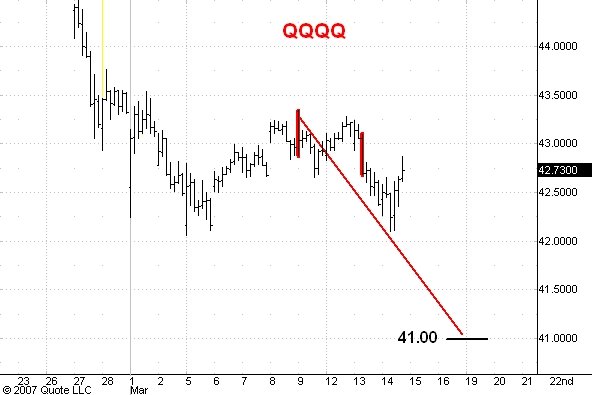
One interesting development has been the action in the Q's today. Unlike the Spiders and the S&P's the Q's did NOT make new lows for the correction this morning. This is a sign of developing strength in the technology sector and is the first indication that this sector may well lead the market up on its next sustained advance. In any case I am raising my downside target for the correction in the Q's from 39.50 to 41.00.
2 comments:
Hello Carl
Any thoughts on the $NDXA200R and 50R re a QQQQ bottom ?
http://stockcharts.com/h-sc/ui?s=$NDXA200R&p=D&yr=4&mn=0&dy=0&id=p30873413382&a=100881293
It looks like the 200R has a way to fall if it is going to behave as it has in past corrections?
TIA
Neet stuff. this looks like the T2108 indicator but that is based on the 40 dma. It will be interesting to see if the 200 dma indicator works.
Ric
Post a Comment