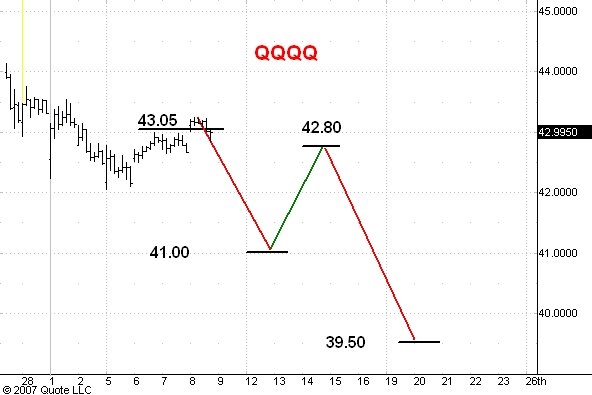
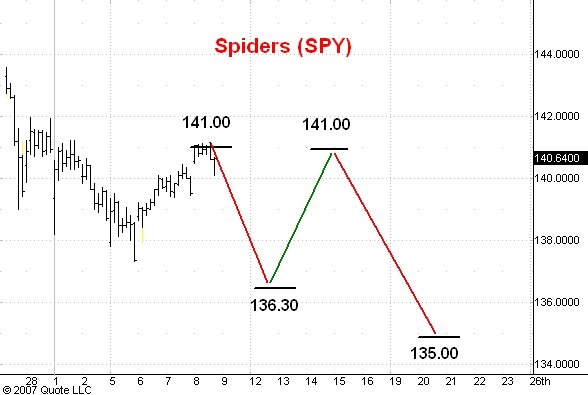
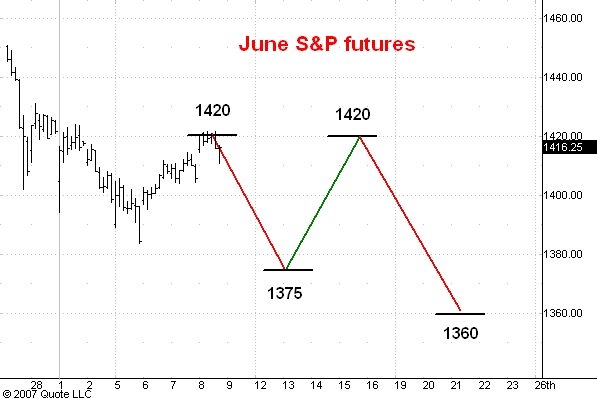
Here are hourly charts of the June S&P futures, the Spiders, and the QQQQ's. I last commented on these markets here.
In this morning's guesstimate I said that resistance in the June S&P's would be found at 1420, in the Spiders at 141.00, and in the Q's at 43.05. I think the rally from the March 5 low ended about an hour ago and that all three markets are now headed downward. I think the June S&P's will drop to 1375, the Spiders to 136.30 and the Q's to 41.00 before another, multi-day rally begins.
My ultimate downside targets for the entire correction are 1360 in the June S&P's, 135.00 in the Spiders, and 39.50 in the Q's.
1 comment:
hi, carl:
why do you think this that this will be a five phase correction instead of 3(such as wave a ,c,e and down and b and d up)? thanks.
Post a Comment