

Here are hourly charts of the March S&P futures, the Spiders, and the QQQQ's. I last commented on these markets here.
I still believe all these markets are going substantially higher. During the past couple of weeks the Q's have underperformed the Spiders, but I think this situation is about to reverse itself.
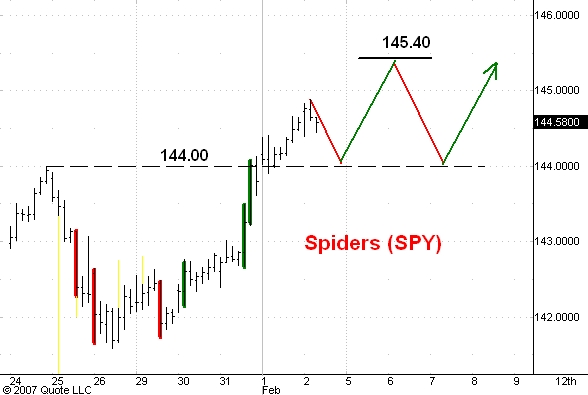
My best guess now is that a small reaction is underway and will carry the S&P's to 1445, the Spiders to 144.00 and the Q's to 143.70. The subsequent rally should carry the S&P's to 1459, the Spiders to 145.40, and the Q's to 45.00. Then I see another slightly bigger reaction developing, but this too should be followed by new bull market highs after it ends.
After this sideways period the S&P's should move up to 1470, the Spiders to 146.50, and the Q's to 46.00.
1 comment:
thanks, your charts are always a big help....
Post a Comment