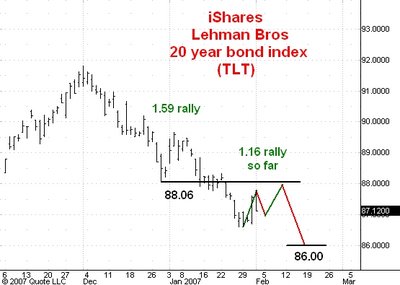

Here are daily bar charts of the March T-bond futures and of the Shearson 20 year bond index i-shares exchange traded fund, TLT. I haven't commented on the bond market in a while. Here is my last post on the subject.
I think these markets are nearing the end of the decline from the December '06 top. The rally which started from the lows a few days ago will probably be a three stage affair as illustrated on the charts. But I think the rally top will be at or a little under the horizontal resistance lines I have drawn at the late December low points.
My best guess is that the futures will make it down to 108-28 and TLT to 86.00 or so. After some subsequent sideways activity both markets should then begin a rally which will carry them over their December tops.
1 comment:
I asked for a TLT chart & comment recently. Thank you.
A decline to 86.00 would take it below the 200dma. Isn't it unlikely for "sideways" basing to occur "just" below the 200 dma ?
Post a Comment