

Here are hourly charts of the March S&P futures, the Spiders and the QQQQ's. I last commented on these markets here.
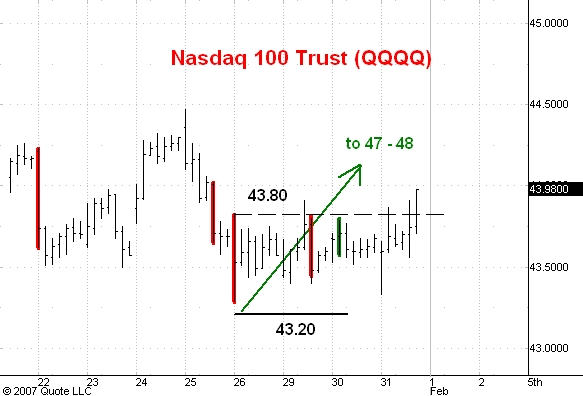
The market has come to life after the Fed announced it would be making no policy changes today. I think all three of these markets have broken above the resistance levels shown on their charts. The breakthrough has occurred on a wide range up bar indicating aggressive buying by longer time frame traders. This is a very bullish sign and means that these markets are headed for the near term upside targets I have indicated on the charts.
3 comments:
the angry bear that said bulls were deluded last week gave us a nice heads up for this rally
i think i'm geting it, spx 1408 box level next target halfway to next box bottom 1445
How do you arrive at your QQQQ target of 47-48? And what is your time frame. A conservatively drawn rectangles give a target of 46.4. Thanks in advance. --Bob
Post a Comment