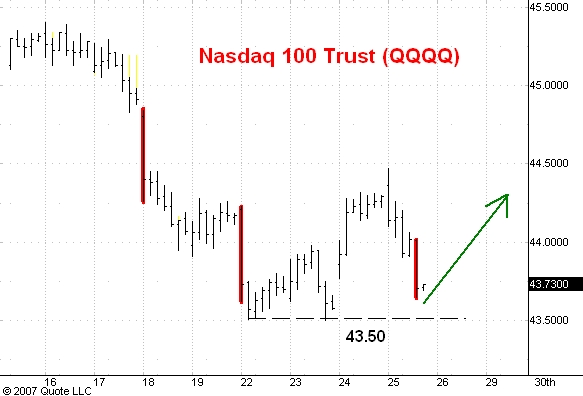

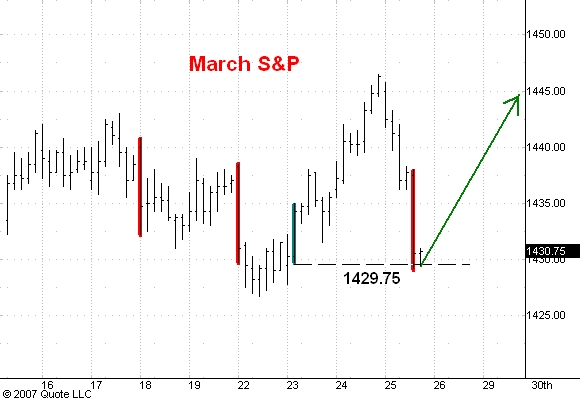
Here are hourly charts of the S&P's, the Spiders, and the QQQQ's. I last commented on these markets here.
The market has dropped sharply today and the S&P's and Spiders have dropped below the estimated support I cited in this morning's guesstimate.
Big declines typically don't begin with a sharp drop on the day the high was made. I think this afternoon's wide range down hour (highlighted in red) will prove to be exhaustion and that longer time frame traders have been buying this break. If I am right about this the markets will not trade much below the last hour's low or below the support levels I have illustrated on these charts.
I think the Spiders will soon resume their move up to 145.00 and that the S&P's will rally to 1455. The Q's should rally into the 47-48 range.
3 comments:
Is it me, or are shake-outs becoming more aggressive?
we have had a very narrow range month so far ... my assumptions leading up to an ultimate peak of 1520 in the S&P was range bound between 1445-1375 ... we have reacted to the 1440 price (and I was heavily short yesterday's close). At todays close I am bullish for a revisit back to the highs and maybe 1445 on the Cash.
Hi Carl,
I would be appreciated if you could provide a bit of analysis for the Chinese index, namely FXI or the Shanghai Composite itself. Thanks
Post a Comment