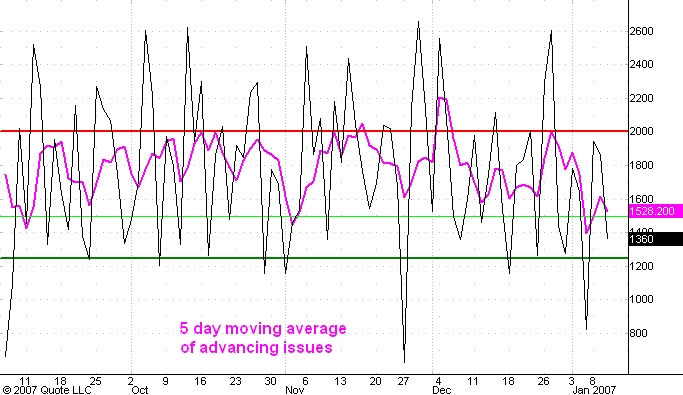
Here is a line chart which records the daily count of the number of issues traded on the New York Stock Exchange which advance in price. The pink line is the 5 day moving average of this number. I last commented on this indicator here.
You can see that a couple of days ago the 5 day moving average dropped to the light green line which indicates a moderately oversold condition. It is remarkable to me that after a three week decline this is the lowest level the 5 day moving average could reach. I think this is a sign of underlying strength and portends much higher prices ahead.
In any case note also that today the S&P made new reaction lows. But the daily count of the number of advancing issues remains above its recent low as does the 5 day moving average. This is a bullish divergence and gives me confidence that the low of the correction which began from the December 15 highs in the S&P has been seen.
2 comments:
Hey Carl,
I remember last time you showed the Adv/Decl issues the market rallied hard in the next few days. I was wondering where you get the chart for them, been interested in tracking them more closely myself.
Carl,
Can you explain the light green horizontal line and what level is this at.
Thanks
Post a Comment