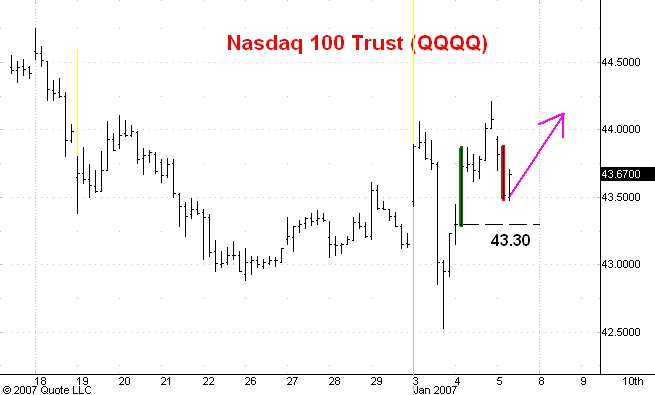
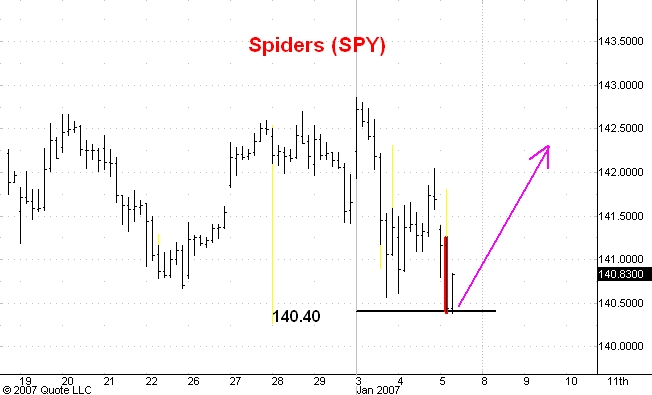
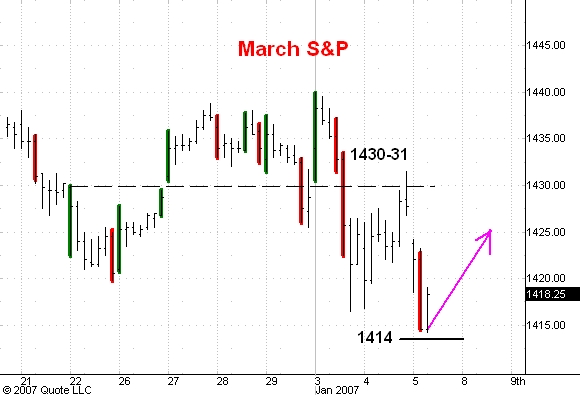
Here are hourly charts of the March S&P futures, the Spider ETF, and the QQQQ ETF. I last commented on these markets here.
Both the S&P's and the Spiders have reached support and are now rallying. Note last hour's wide range down bar. This bar reached support but there has been no follow-through selling. I think this shows that longer time frame buyers were active at the support level so I conclude that we have seen the low of the reaction.
I think that the S&P's are now beginning a rally to 1455, the Spiders a rally to 144.40 and the QQQQ's a rally to 47.50.
Even if I am dead wrong in my view that the correction is complete the most I see on the downside from here is about 1408 in the S&P's and 139.60 in the Spiders.
No comments:
Post a Comment