

Here are hourly charts of the March S&P futures, the Spiders ETF and the QQQQ ETF. I last commented on these markets here.
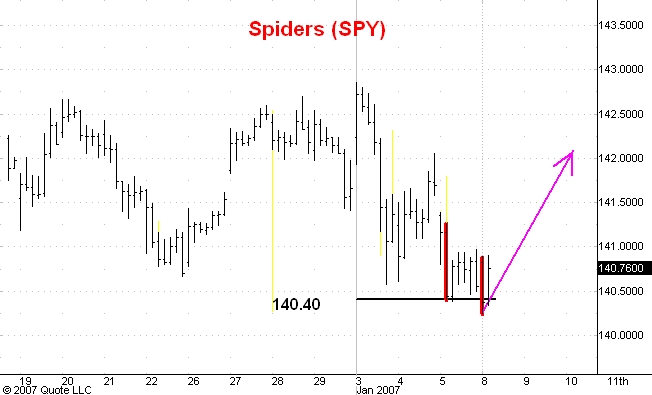
The corrective phase which started at the 1445 level on December 15 in the S&P futures and at 143.24 in the Spiders the same day has lasted more than three weeks but has only dropped these markets about 2 % from their highs. The support levels I have been watching for the S&P's and Spiders are illustrated on the charts above. You cas see that they were reached Friday and slightly broken this morning.
What impresses me about the market's action is that early Friday and again early today the market put in wide range down bars whose lows were at support. But in neither case was there any follow through selling. This tells me that the buyers in both instances were longer time frame traders. This is an increasingly bullish situation and I think both these markets are about to begin and advance to their upside targets: 1455 in the S&P's and 144.40 in the Spiders.
The QQQQ's have been acting better that both S&P markets. I think the QQQQ's are headed up into the 47.00 to 48.00 range.
1 comment:
I am continue thinking that we will see and minimum friday,the market does not have to lower much more that 12.080 in dow jones.There a recovery for the next week and the bear can prepared to press the market to the abyss.
Be prudent.
Post a Comment