Here is a weekly chart of the cash S&P 500 index. I last commented on the weekly S&P chart here .
I believe the most fundamental principle of market analysis is to look for precedents for the current situation in recent market action. So to make an educated guess of the ultimate low of the current reaction in the S&P's I look to previous reactions in the current bull market as guides.
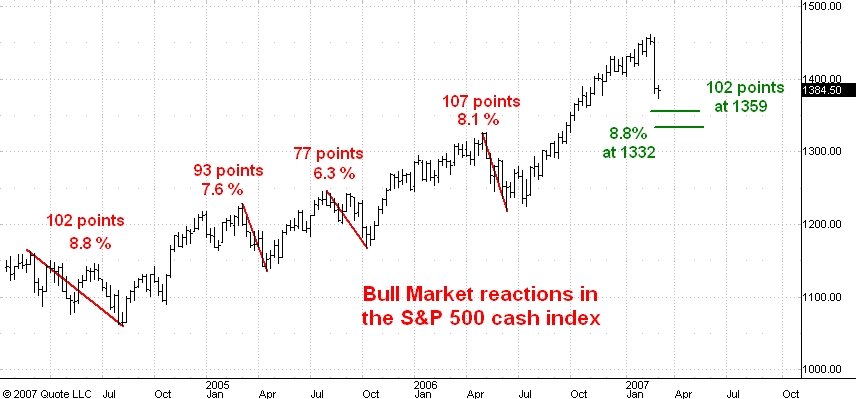
On the weekly chart above you will see the four previous big reactions which have developed during the past three years. Above the start of each I have listed the number of points the market subsequently dropped as well as the extent of the drop in percentatge terms.
I still see no sign that the reaction from the 1461 level in the S&P is complete. Here are some of my reasons.
First, it shows no distinct three phase structure yet. Second, the advancing issues indicator has seen the 5 and 10 day moving averages move to new reaction lows yesterday. At the final low in the S&P I would instead expect to see a bullish divergence, at least in the 10 day moving average, which would take the form of a lower low in the S&P but a higher low in the 10 day moving average. I estimate we are at least 2 weeks away from such a divergence.
Finally, we have the state of market sentiment. I think the media are doing their best to encourage bearish sentiment (as is the market's action itself !!) but I do not think the level of short term bearish sentiment is yet at the point where it can support a move to new bull market highs.
Given these considerations I think it is reasonable to look for an end to the current correction at the point where it will equal the length of the biggest reaction in the bull market so far. This is the March-August 2004 break. Measuring 102 points off of th e1461 high would bring the S&P cash down to 1359, while measuring 8.8% down would bring it to 1332.
Note that both of these levels are above the 1327 level which marked the start of the May-June 2006 break and as such is important bull market support.
2 comments:
Carl,
I read your blog daily. Thank you for the illustration, the market correction targets, and estimated time frame. I have found that the 65 weekly moving average approximates the depth of corrections for the past 3 years of the of the SPX bull market. The Stockcharts version currently shows aproximately 1327 simple moving average versus 1336 for an exponential moving average.
July 2007 is when the next 52 month cycle is due, so this decline should continue into the summer down into the SPX 1200's.
52 month cycle is the dominant market cycle and is the one that 'stands out' when you glance at a chart of the 50's 60's and 70's.
The old Rothschild adage "buy cannons, sell trumpets" is also in play. British announcement of troop pullout occurred 2 days before the top. Other peace news is also coming in which is bearish.
Post a Comment