Wednesday, March 08, 2006

US Dollar Index


Here is a weekly chart of the US Dollar index.

I have been very bullish on the dollar since early 2005. One of the things that made it easier to identify this bull market in the dollar in its early stages was this investment advice offered by the New York Times.

At this juncture I am looking for a move in the dollar index to the 96.00 level and eventually to 100 or so.

Crude Oil


Here is an hourly chart showing pit trading in April crude oil futures.

I think this market is headed for the next downside target in the 56.80- 57.20 zone.

Notice how the drop from point e has gone farther and lasted longer that the drops from a to b and from c to d. Moreover, looking within the swing downward from e we see that the successive breaks are expanding in extent and duration. Finally, the down bars in this swing show consistently big ranges compared with the up bars. This indicates that volume is heavier on the downside and sellers are confident and agressive. All these considerations point to the same conclusion: much lower prices lie ahead.

Google


Here is an udpated 15 minute bar chart of Google which I last discussed here.

Late yesterday there was another piece of upsetting news for Google involving a mistaken posting on its web site that may have misled investors.

When I am bullish on a stock or a market and bad news comes out I look for signs of a selling climax, especially one that occurs at support and at a higher low. I think that this is what we are seeing in GOOG.

I estimate support today at 351. We clearly had a big volume spike on bad news at the open. that dropped the market to 353 and change. This is the biggest volume bar on the decline from 387 which has shown greatly reduced volume compared with the previous advance.

The rally from g to h was about as big as the rally from e to f but the drop from f to g took a lot less time than the one from d to e. If we see a slightly lower low at a possible point i near 351 and then rally above point h I will think that the low of the reaction from 387 is in place. Alternatively, any high volume break above point h would send the same message.

Silver


Here is an hourly bar chart showing pit trading in May silver futures.

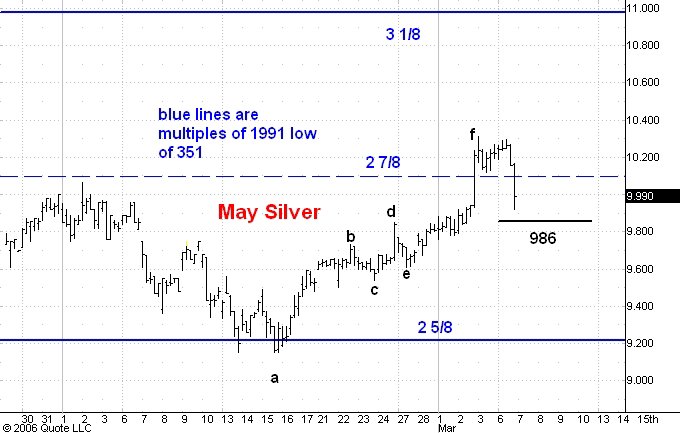
The market has broken below what should have been support at 986 on a very wide range bar, which I use as a proxy for a high volume bar in markets that don't offer real time trading volume numbers. From this I conclude that the move above the 1000 level was a head fake and that the market has begun an extended drop which will probably carry it at least to 850.

Resistance above the market is at 988 and the next down swing should carry to the 920 level.

S&P


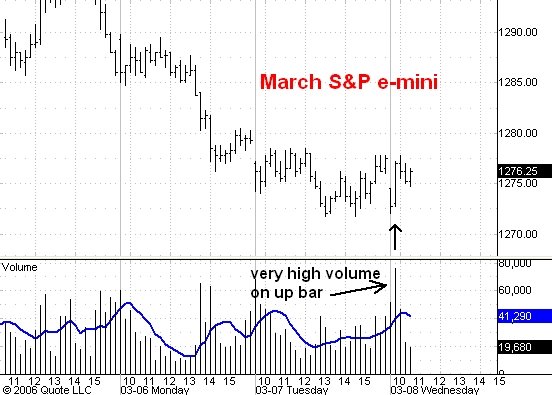
Here is a 15 minute bar chart showing regular hours trading in the March S&P e-mini futures. Tomorrow activity will switch into the June futures which are trading about 10 points higher than March.

Yesterday afternoon I pointed out that volume has started to show a definite pattern of increasing on up bars and as you can see this tendency has continued this morning. I think this is a bullish portent and that the market will soon move above 1280 and continue on to 1320.

Guesstimates on March 8 , 8:50 am ET

March S&P Futures:  I think the market will again close today above the 1275 support level and then start a move to 1320.

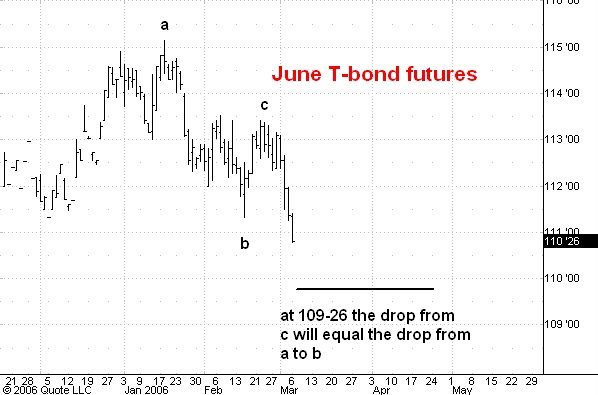
June Bonds: The bonds nearly reached 111-00 in electronic trading and now are on the way down to the 110-00 to 08 zone. The second upward phase of the rally to 111-16 still lies ahead. I think the market is on its way into the 107-108 zone over the next few months.

June 10 Year Notes:  Support is still at 106-12 and I think the notes will rally to 107-12 or so over the next few days. I think notes will reach 104 or so in a few months.

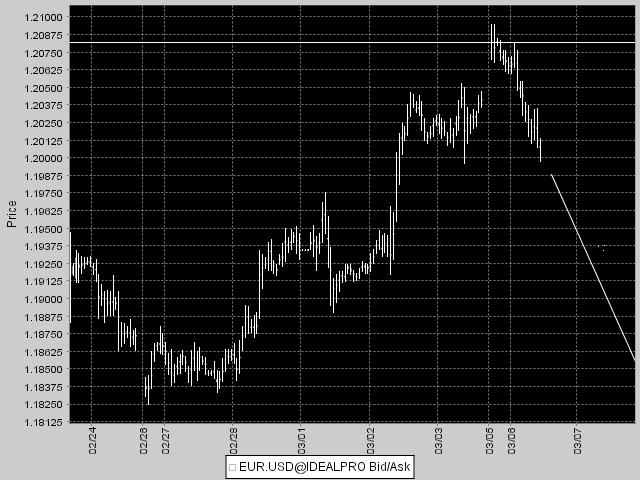
Cash Eurocurrency: The next downside target is 116.70. A drop to 113 and below is underway.    

April Crude: Downside target is the 56.80 to 57.20 zone. Crude is headed for 52.00 and eventually lower than that.

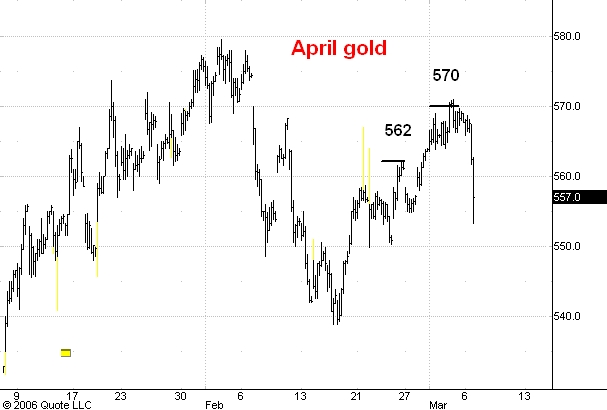
April Gold: I think a lower top was made at 572 and that the market is now headed for 512.

May Silver: As long as support near 986 holds there is a good chance the market will reach 1096 before beginning a big break.

Google: GOOG keeps getting hit by nasty surprises. Support today is 351 and the next significant development will be a rally to 405 and then to 495.

Tuesday, March 07, 2006

S&P at 3 PM ET


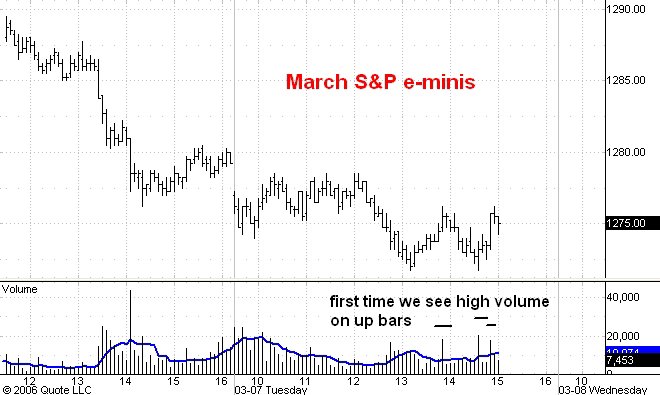
Here is a 5 minute bar chart giving us a detailed look at the trading in the March S&P 500 e-mini futures today.

I am expecting the market to hold here and begin a big rally. This morning we saw what I think was a selling climax althought the market did not hold its climax low as well as I would have liked.

Nonetheless, we can see that trading during the past hour has given us some supporting bullish evidence. You can see that for the first time today higher volume is starting to appear on up bars. This tells us that the bulls are starting to be aggressive buyers at current levels because there are not enough offers hitting their bids at lower levels.

I think this is the first concrete evidence that an upward turn is imminent.

NYSE Advancing Issues


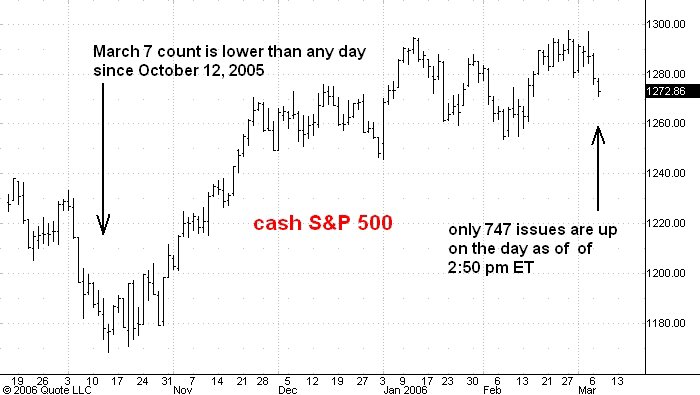
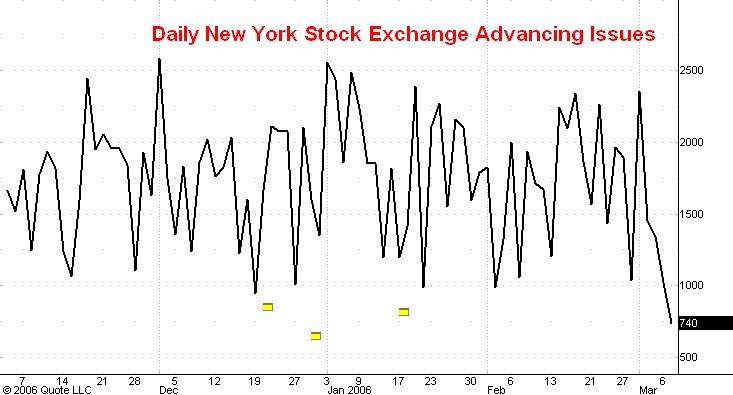
The first chart you see above the post depicts the daily count of the number of issues on the New York Stock Exchange that advance in price.

I want to point out that so far today's reading is the lowest since the October 12, 2005 reading. That was the day that preceeded the low at 1168 in the cash S&P. Generally speaking, when the market is making higher lows and then shows an extremely low daily reading in the advancing issues number it is telling us that a low is forming and that a strong rally lies dead ahead. I think that this is the message it is sending us today.

Google


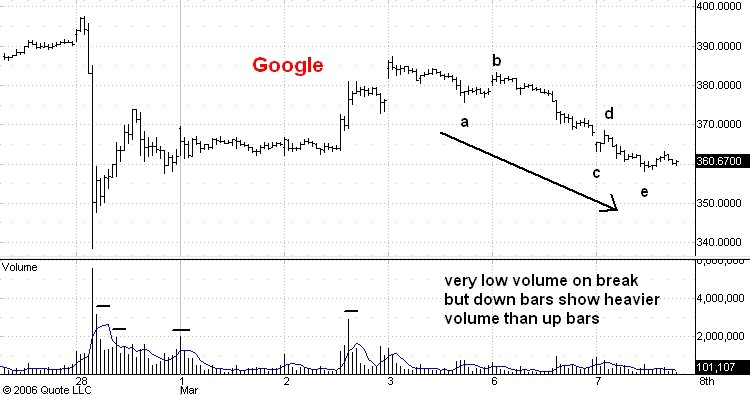
Here is a 15 minute bar chart of Google. I last discussed this chart here.

I think the 337 low is going to hold and that GOOG is going to reach the 495 level in a couple of months. Meantime you can see that the market has been drifting downward from the 387 top it made just after the break to 338.

This drop from 387 has shown consistently low volume, especially when compared with the rally from 338 to 387. This is a bullish indication. But note that so far the heaviest volume on the break has been on the down bars. Thus the volume indications have not yet told us that another upswing has started.

There is some bullish evidence to be seen on the chart. Note how the downswing from point d to point e was shorter in time and extent that was the preceeding downswing. This is the first piece of evidence that the drop from 387 may be ending. I'd like to see a rally bigger than the rally from a to b together with some obvious sign of increasing volume before I conclude that the drop from 387 is complete.

S&P


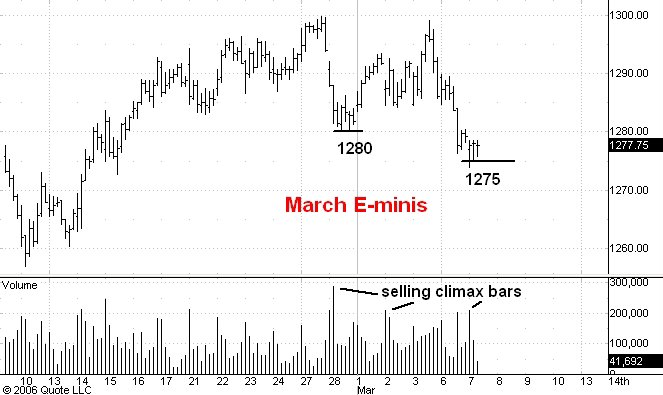
Here is an hourly chart of regular hours trading in the March S&P e-mini futures.

I have highlighted three volume climax situations on the chart, today's opening hour being the last of the three. The key thing to look for is unusually high volume developing at a support level with little or no downside price follow through.

Since I estimate support at 1275 I believe that today's opening hour volume and the two subsequent sideways hours is telling us that the market is about to rally significantly. I think we will see 1320 by the end of the month.

T-bonds


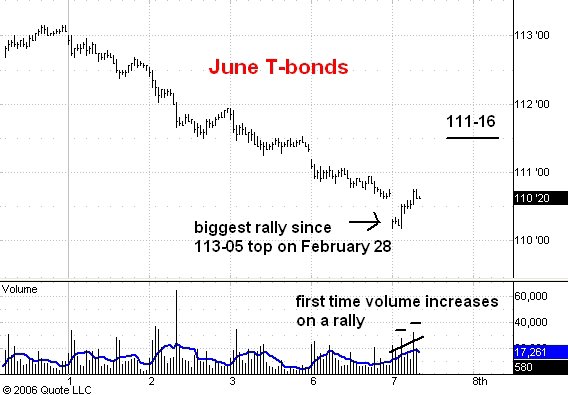
Here is a 15 minute bar chart of trading in June T-bond futures during regular trading hours.

Yesterday I said that a minimum target for the break from the February 28 top at 113-05 was 109-26. This morning in electronic trading the market hit 109-31 and has since rallied.

Notice that the rally so far has been bigger than any rally since the February 28 top. More importantly, volume has shown a pronounced tendency to be high on up bars, a reversal of its pattern during the previous break. These two fact make me believe that a typical three stage rally has begun from the 109-31 low. The rally will have two upward phases separated by a reaction that will probably carry the market down close to 109-31 again. The last upward phase will probably end near 111-16. After that I expect the market to resume its downtrend toward 108 and lower.

Guesstimates on March 7 , 8:50 am ET

March S&P Futures:  I now think the market will close today above the 1275 support level and then start a move to 1320.

June Bonds: The bonds nearly reached 109-26 early this morning, breaking below minor support at 110-12.  Resistance above the market today is at 110-20. I think the market is on its way into the 107-108 zone.

June 10 Year Notes:  The notes dropped below 106-16 this morning, reaching the 106-12 level. Resistance today will be at 106-30. I think notes will reach 104 or so in a few months.

Cash Eurocurrency: The next downside target is 116.70. A drop to 113 and below is underway.    

April Crude: Resistance is near 63.50 and the next swing should drop the market to 57.20. Crude is headed for 52.00 and eventually lower than that.

April Gold: I think a lower top was made at 572 and that the market is now headed for 512.

May Silver: As long as support near 986 holds there is a good chance the market will reach 1096 before beginning a big break.

Google: GOOG should hold 363 today and then rally to 405 and then to 495 in a couple of months.

Monday, March 06, 2006

S&P


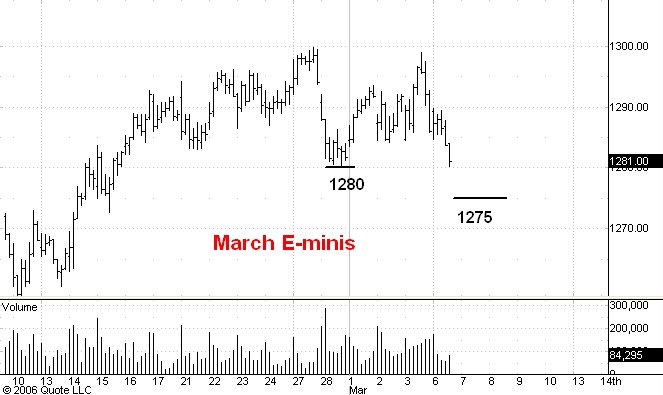
Here is an hourly chart showing regular hours trading in the March S&P e-mini futures.

Friday I thought that the market was about to break out above the 1300 level but this breakout failed to materialize.

After trading near Friday's close for almost four hours the market has finally broken to the downside on increasing volume. This is the third time it has reached the 1280 level and this time I think it will go through and reach support near 1275. From the latter level I think the S&P's will start a move above the 1300 level.

Crude Oil


Here is an hourly chart showing pit trading in April crude oil futures.

The market has again bounced off of resistance at 63.50. This time I think it will drop into the 56.70 -57.20 zone before another significant rally can develop.

Gold


Here is an hourly chart of pit trading in April gold futures.

The apparent breakout above 1000 in silver made me think that gold might have more on the upside too, but today's high volume break instead makes the 571 high stand out as the first important lower top since the February 2 top at 579.50. After a lower top the market generally will make a lower low so I think it is now headed down to 512 and evenutually lower than that.

Silver


Here is an hourly chart showing pit trading in May silver futures.

The high volume breakout to new contract highs near point f convinced me that the market would have to rally to 1095 or so before any big break occurred. Today you can see that the market has broken below my estimate of short term support at 1000 on very high volume (not shown).

The swing up from point e to point f was the longest of the upswings in the move up from point a. But now the break from point f is bigger and has lasted longer that any of the breaks prior to point a. This is evidence that the move up from point a is over and that a move down close to point a or even lower has begun. However, I am as yet not completely convinced of this and will wait for the market to test support at 986. If this latter level is broken then I will conclude that a move to 915 and probably lower has started.

T-bonds


Here is a daily chart of the June T-bond futures.

The market rallied from a low in early November (at 110-12 basis December '05 futures) to a high in January at 115-13 in the March futures. I think we are in the middle of the second downswing from the 115-13 high. The first carried the March futures down 115 ticks from point a to point b. The market then rallied to point c at 113-13 in the March contract. Another drop of 115 ticks from point c in the June contract would carry the market to 109-26 or so. In fact I think the second swing down which started from point c will be longer than the first, so 109-26 is a minumum target.

As you know I expect this market to drop to 108 or lower over the next few months so only a modest rally will result once the swing down from point c is completed.

US Dollar/ Euro


Here is an hourly chart of the cash US Dollar/Euro pair. The market has bounce off of resistance at 120.80 and I now think it is headed for the 116.80-117.20 zone.

Guesstimates on March 6 , 8:50 am ET

March S&P Futures:  The late break Friday surprised me but I think the 1280 level is going to hold.  Next upside target is 1304 and after that 1320.

June Bonds: Next downside target is 110-12. I think the market is on its way into the 107-108 zone.

June 10 Year Notes:  Next downside target is 106-16. I think notes will reach 104 or so in a few months.

Cash Eurocurrency: The market should hold below 120.80. The next downside target is116.70. A drop to 113 and below is underway.    

April Crude: Resistance is near 63.50 and the next swing should drop the market to 57.20. Crude is headed for 52.00 and eventually lower than that.

April Gold: Still holding resistance at 570 but silver’s upside breakout makes me think gold can move up to 590 before a big drop begins.

May Silver: Yesterday’s upside breakout on high volume means that the market is headed for 1095.  Meantime support should be at 1000.

Google: GOOG will probably react to 370 or so but then rally to 405 and then to 495 in a couple of months.

Friday, March 03, 2006

Google


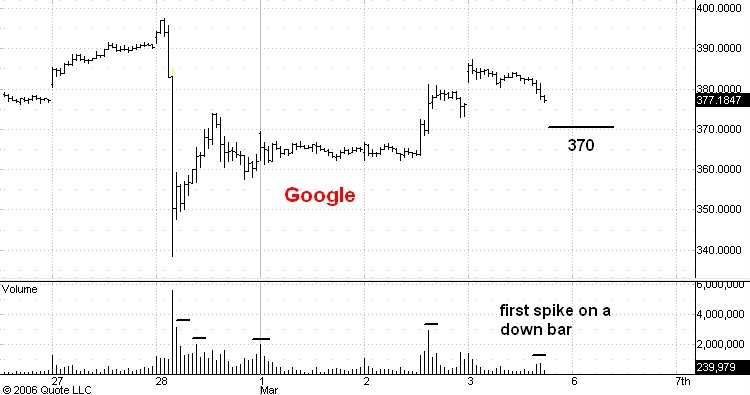
Here is a 15 minute bar chart of Google.

GOOG has rallied nicely from the 338 low which occurred after Google's CFO had his little conference call with the analysts. I am especially impressed by the series of volume spikes that occurred on wide range up bars. This indicates to me that buyers were willing to be agressive in the face of apparently bad news. People who buy under such conditions are not likely to sell anytime soon so this strengthens the market's technical position.

Today we saw the first modest volume spike on a wide range down bar. This is late confirmation that the market is reacting from today's high at 387. I am still very bullish on GOOG and on the market in general so I think this reaction will probably stop near 370. From there GOOG should move above 400.

Chicago Merchantile Exchange


Here is a daily chart of the Chicago Merchantile Exchange.

As you can see CME has been one of the strongest stocks in the market over the past 3 years and this superior performance has continued over the past 3 months.

My original target for CME was 411 which I then raised to 441. Since the latter target has been achieved and since the bull market in the averages and in CME looks like it has a fair amount left on the upside, I am raising my target for CME to 500.

S&P Update


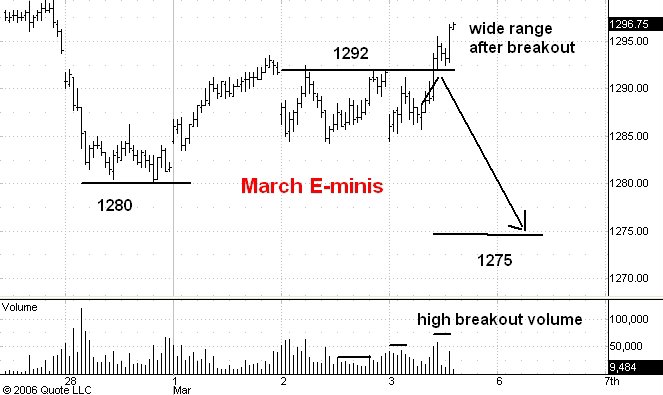
Here is an updated 15 minute bar chart of the March S&P e-mini futures.

This morning I said that the market would probably rally to 1293. As you can see on the chart it has done that and more. In fact, move above the 1293 level now looks like a genuine upside breakout to me. Here's why.

The breakout volume was high as you can see on the chart. In fact it was even higher than it looks because it occurred during the lunch hour in New York, usually a slow time for all markets. After the breakout the market drifted back to 1293 but on low volume. Had the breakout been a fake one we would instead have seen the S&P dive back below 1293 and stay there. After the low volume test of the breakout level the market put in a wide range bar to new rally highs. Moreover, by this time the S&P's were more than 4 points into plus territory for the day.

The combination of these factors has convinced me now that the 1280 level was the reaction low and that we will soon be above 1300 and headed for 1320.

Board of Trade


Here is a daily chart of the Chicago Board of Trade.

I last discussed BOT here. As you can see on the chart the stock has significantly outperformed the market averages since mid-January. The volume pattern (not shown on the chart) shows several relatively high volume days associated with wide range up days during the advance. Both relative strength and volume make me confident that BOT will hit 142 (at least) before any extended drop begins.

S&P


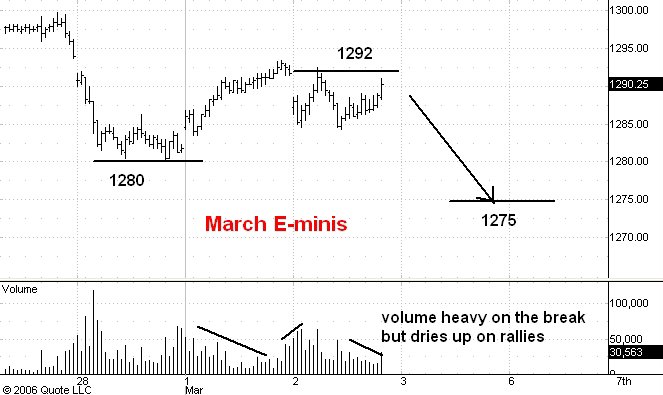
Here is a 15 minute chart of regular hours trading in the March S&P e-mini futures.

As you can see the market has been locked in a 1280-1292 trading range the past few days. This morning, in electronic trading, the e-minis dropped to 1280 before bouncing upward and this rally continued when regular trading hours began.

I have highlighted the fact that volume on the move up this morning was high relative to the volume on yesterday's afternoon rally. Morever, on the break from this morning's high trading volume showed a definite tendency to contract. This makes me think that the upmove from the 1280 electronic low this morning is not yet complete. I think we will see the market rally to 1293 or so today and then drop to 1275 early next week.

Guesstimates on March 3 , 8:50 am ET

March S&P Futures: I think the market will now drop to 1275 or so before beginning an upswing to 1320.

June Bonds: The market bounced off of support at 111-16 but won’t go much higher than112-08. Next downside target is 110-12. I think the market is on its way into the 107-108 zone.

June 10 Year Notes: The notes dropped a bit below support at 107-10 and any rally from current levels should halt near 107-24. Next downside target is 106-16. I think notes will reach 104 or so in a few months.

Cash Eurocurrency: The market breached resistance at 119.80 yesterday but should hold below 120.80. The next downside target is116.70. A drop to 113 and below is underway.

April Crude: Resistance is near 63.50 and the next swing should drop the market to 57.20. Crude is headed for 52.00 and eventually lower than that.

April Gold: Still holding resistance at 570 but silver’s upside breakout makes me think gold can move up to 590 before a big drop begins.

May Silver: Yesterday’s upside breakout on high volume means that the market is headed for 1095. Meantime support should be at 1000.

Google: I think the 337 low will hold and that the next move will carry GOOG to 405 and then to 495.

Thursday, March 02, 2006

S&P Update


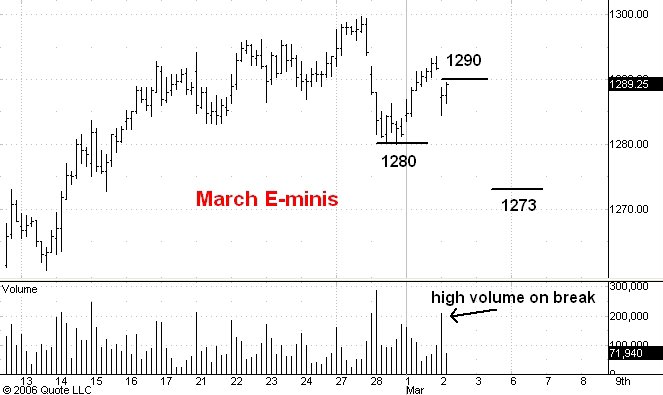
Here is a 15 minute chart of regular hours trading in the March S&P e-mini futures.

The market bounced off of resistance in the 1290-91 range this morning, dropped all the way back to the early morning low and now has rallied back to the 1290 level.

Volume on this last rally has dropped as prices have risen and thus the volume pattern has stayed in step with its previous bearish message. I conclude that resistance at 1292 will hold and that the market will take another step down to my revised downside target at 1275.

After that I am still looking for a move to 1320.

Crude Oil


Here is an hourly chart of pit trading in April crude oil futures.

Contrary to my expectation the market has bounced a second time off of the support level at 60.20. I still expect the 63.50 level to act as a lid to the rally and the next significant move should be downward to 57.20.

Silver Update


Here is a line chart of the hourly closes during pit trading in May silver futures.

I had thought that the 1006 top of February 12 would start a drop to 800 but today the market took out that high decisvely on high volume.

I have to conclude that May silver is headed for the next strong resistance level at 1096, the 3 1/8 multiple of the 1991 low of 351.

The swings back up toward the 1006 level had grown progressively shorter. This is normally a bearish indication. But now the last swing from point e has become the longest of the three upswings so far so the market not only has taken the bearish implications of a swing analysis of the move up from 915.

I would expect the 1000 level now to function as support for any reaction back toward the breakout level.

Silver


Here is and hourly chart showing pit trading in May silver futures.

I still think this market is headed down to 800 or so but the rally from 915 has exceeded my first two targets of 960 and 982. Now my best guess is that we will see a top around the 1000 level and near the February 12 high of 1006.

Google


Here is an updated daily chart of Google. I last commented on this particular chart here.

The big break following Google's CFO little private chat with the analysts hasn't changed the picture in my opinion. The strong support at the 3 5/8 multiple of the all time low price of 95.96 held. Moreover, the huge volume (all in 30 minutes of trading) couldn't force the market below support for more than a few minutes and this makes the successful test of support even more impressive.

I think the 337 low is going to hold and that the market will soon be trading above 400.

S&P


Here is an hourly chart of the March S&P e-mini futures.

The first hour break this morning occurred on high volume. This after the low volume rally yesterday is more evidence that the market is on its way to 1273 or so. Today the 1290-91 zone should be resistance.

Guesstimates on March 2 , 8:50 am ET

March S&P Futures:  I think the market will now drop to 1273 or so before beginning an upswing to  1320.  

June Bonds: The next downside target is at 111-16 while resistance today is again at 113-08. I think the market is on its way into the 107-108 zone.

June 10 Year Notes: Resistance is at 108-04 while the next support level beneath the market is at 107-10. I think notes will reach 104 or so in a few months.

Cash Eurocurrency: The next downside target is117.20 while resistance is still at 119.80. A drop to 113 and below is underway.    

April Crude: The market is on its way to 57.20 Crude is headed for 52.00 and eventually lower than that.

April Gold: I think a drop of $100 is underway. The market should hold resistance at 570 and then drop to 512.

May Silver: I think a drop of $2.00 is underway. The market has moved a little past 982 resistance but I think it will soon drop to 870.

Google: I think the 337 low will hold and that the next move will carry GOOG to 405 and then to 495.

Wednesday, March 01, 2006

Gold


Here is an hourly chart showing pit trading in April gold futures.

I had expected the market to halt its rally near 562 but it has continued upward to 569. I now expect the market to halt near 570. In fact today there was very heavy volume (not shown) on the drop from the high so there is an excellent chance that the rally is over. In any event the next event will be a drop to 512 or so.

S&P


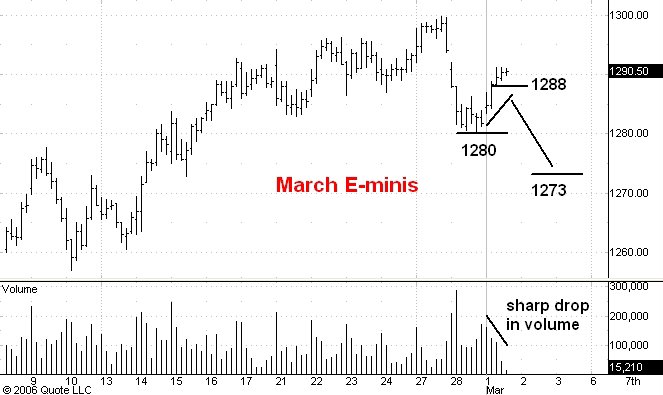
Here is an hourly chart of the March e-mini S&P futures.

I thought the market would rally up into the 1288-9 zone but in fact the market has rallied more than I expected, so far as high as 1291.25. But as you can see on the chart volume has dropped sharply as the market has rallied. This is an indication that the rally is just a temporary interruption of a bigger downtrend, one which I still expect to carry to 1273. I think the rally from 1280 is complete and that a swing down to 1273 is about to begin.

After the drop to 1273 is complete I am expecting a move up to 1320 and then to 1350.

Guesstimates on March 1 , 8:50 am ET

March S&P Futures:  I think the market will rally to 1288-9 and then drop to 1273 or so.  After that a move to 1320 will probably begin.

June Bonds: The next downside target is at 111-16 while resistance today is again at 113-08. I think the market is on its way into the 107-108 zone.

June 10 Year Notes: Resistance is at 108-04 while the next support level beneath the market is at 107-10. I think notes will reach 104 or so in a few months.

Cash Eurocurrency: The next downside target is117.20 while resistance is still at 119.80. A drop to 113 and below is underway.    

April Crude: The market is on its way to 57.20 Crude is headed for 52.00 and eventually lower than that.

April Gold: I think a drop of $100 is underway. This morning the market has moved a little above resistance at 562 but I still think it will soon start a drop to 512.

March Silver: I think a drop of $2.00 is underway. Late yesterday and early this morning the market moved a little past 972 resistance but I still think it will soon drop to 860.

Google: I think the 337 low will hold and that the next move will carry GOOG to 405 and then to 495.

Tuesday, February 28, 2006

S&P Update


Here is an updated hourly chart showing regular hours trading in the March E-mini futures.

The market has stalled at the first support level I discused this morning, but volume is still relatively high. I think this means that we are about to see a rally to a lower top around 1288 and then a second break down to 1273 or so.

I remain confident that the market will reach the 1350 level by the end of April.

Google


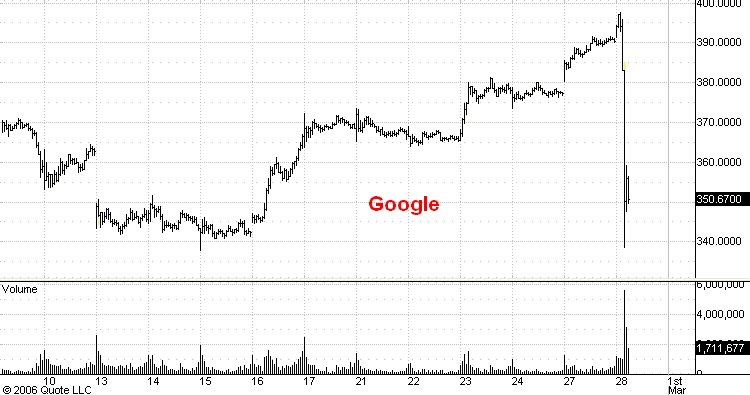
Here is a 15 minute chart of Google showing its activity after the 337 low following the Barron's article two weeks ago. This morning Google's CFO tried to deflate expectations of an ever growing (!!!!) growth rate by observing that as GOOG grew its growth rate was declining. Typical of every business I've ever seen.

But as you can see on the chart traders shoot first and ask questions later. In less that half an hour GOOG dropped almost 60 points, all the way back to 338. It is too early to tell from market activity whether 337 will hold or not. My own guess is that it will hold or be broken by only a couple of points. My reason is that the 337 level is just a little below very strong support at 347 and is itself strong support for other reasons. Plus this break occurred on very high volume but didn't drop below 337 (so far). This gives it the appearance of climatic selling on news which typically occurs near the end of a trend rather than near its beginning.

S&P


Here is an hourly chart of regular hours trading in the March S&P E-mini futures.

This morning I said that the 1285 level would be support but the market's action so far today is telling me that 1285 will not hold. Why?

First, most corrections have two distinct downward phases separted by a very visible rally to a lower top. So far this correction shows only one downward phase. Second, the volume on this break has been substantially higher than the volume on the previous two breaks. This shows up very clearly on the second chart above this post which records trading over the past month in 15 minute bars. The volume pattern is characteristic of a market in the middle of a move, not near the end of one.

How far down will the correction carry? One guess is 1280 or so, but for this to work we must see an obvious upward move first plus a clear volume reduction near the low. My second choice for support is the 1273 level and right now this is looking to be the more likely of the two choices.

Guesstimates on February 28 , 8:50 am ET

March S&P Futures:  Support is still at 1285 while the next minor resistance is 1304. The market should reach the 1350 level by late April.  

June Bonds: The next downside target is at 111-16 while resistance today is again at 113-08. I think the market is on its way into the 107-108 zone.

June 10 Year Notes: Resistance is at 108-04 while the next support level beneath the market is at 107-10. I think notes will reach 104 or so in a few months.

Cash Eurocurrency: The next downside target is117.20 while resistance is still at 119.80. A drop to 113 and below is underway.    

April Crude: The market is on its way to 57.20 Crude is headed for 52.00 and eventually lower than that.

April Gold: I think a drop of $100 is underway. Resistance today is again at 562. Next support on the way down is at  512.  

March Silver: I think a drop of $2.00 is underway. Resistance today is again at 972. Next short term support is at 860.

Google: Short term resistance above the market is at 405 while support is at 378. Once GOOG leaps over resistance at 405 it will be headed for the next upside target at 495.

Monday, February 27, 2006

Bonds


Here is an hourly chart showing pit trading in the March T-bond futures. I shall be switching to the June contract tomorrow but because the yield curve is slightly inverted there is no spread between the March and June contracts.

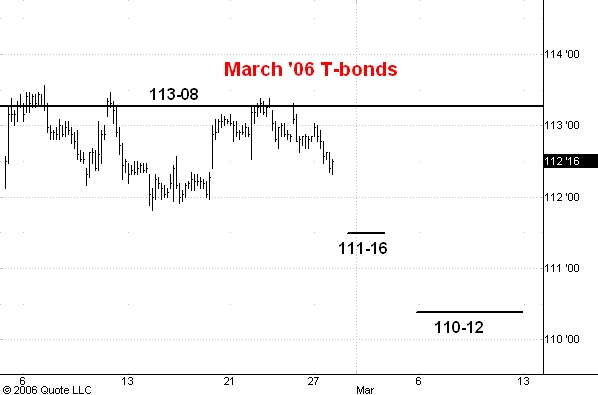
It looks to me like the market is about to break downward out of the past month's trading range. There will probably be a brief stop near 111-16 but I expect to see the bonds trading near 110-12 very soon.

Google


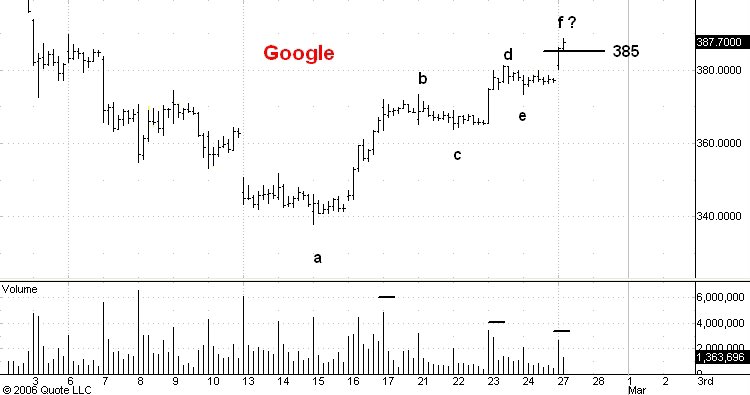
Here is an hourly chart showing regular hours trading in Google.

I think the 385 level is minor resistance. Whenever a market reaches a support or resistance level, especially one that is within an obvious trading range, it is generally good practice to see if the market is giving any confirming indication that it will indeed bounce off of that level.

On the Google chart I have labeled the extremes of the recent swings. Notice how the successive upswings a-b, c-d, and e-f have grown progressively shorter in extent and duration. Notice too how each successive upthrust occurred on less volume than the previous one.

Both these indications are signs of weakness and indicate to me that the 385 level will produce a reaction of at least 10-20 points. But I am still very bullish on GOOG and so I am willing to let the market contradict these indications. So an hourly close at 390 or higher would tell me that the market has to reach 405 before any substantial correction will occur.

Crude Oil


Here is an hourly chart showing pit trading in April crude oil futures.

I was expecting the market to rally from 60.20 to 63.50 but it never made it to the upside target. Now I think a move down to 57.20 has started.

This activity is part of a bigger down trend which I think will carry the market to 52.00 and eventually lower than that.

Guesstimates on February 27 , 8:50 am ET

March S&P Futures:  Support is still at 1285 while the next minor resistance is 1304. The market should reach the 1350 level by late April.  

March Bonds: The next downside target is at 111-16 while resistance today is again at 113-08. I think the market is on its way into the 107-108 zone.

March 10 Year Notes: Resistance is at 108-04 while the next support level beneath the market is at 107-10. I think notes will reach 104 or so in a few months.

Cash Eurocurrency: The next downside target is117.20 while resistance is still at 119.80. A drop to 113 and below is underway.    

April Crude: I still think it will reach 63.50 before beginning a drop to 57.20. Crude is headed for 52.00 and eventually lower than that.

April Gold: I think a drop of $100 is underway. Resistance today is again at 562. Next support on the way down is at  512.  

March Silver: I think a drop of $2.00 is underway. Resistance today is again at 972. Next short term support is at 860.

Google: Short term resistance above the market is at 385 while support is at 364. Once GOOG leaps over resistance at 405 it will be headed for the next upside target at 495.

Friday, February 24, 2006

USD / Euro


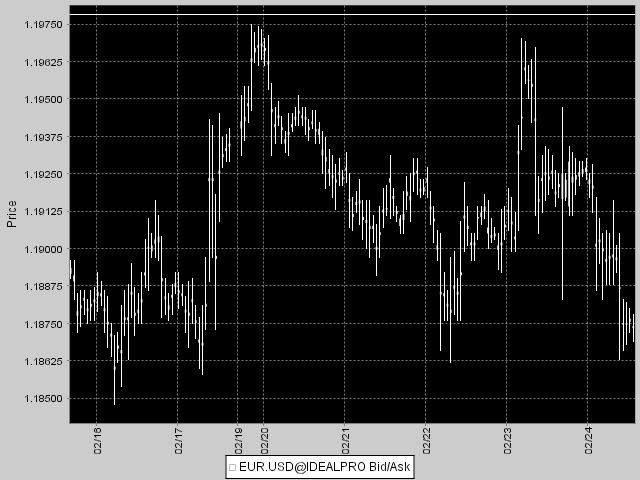
Here is an hourly chart of the cash US dollar /Euro currency pair.

The market has held below resistance at 119.80 the past couple of days and I think will soon reach its next downside target at 117.20 (revised downward from 117.90).

Gold and Silver


Here are hourly charts showing pit trading in April gold and March silver futures.

Both markets have reached resistance and the next big move from here will be downward to 512 in gold and 860 in silver.

Crude Oil


Here is an hourly chart showing pit trading in April crude oil futures.

The market is approaching the 63.50 target I cited yesterday. The next big move will be downward to 57.20.

Guesstimates on February 24 , 8:50 am ET

March S&P Futures:  Support is still at 1285 while the next minor resistance is 1304. The market should reach the 1350 level by late April.  

March Bonds: The next downside target is at 111-16 while resistance today is again at 113-08. I think the market is on its way into the 107-108 zone.

March 10 Year Notes: Resistance is at 108-04 while the next support level beneath the market is at 107-10. I think notes will reach 104 or so in a few months.

Cash Eurocurrency: The next downside target is117.90 while resistance is at 119.80. A drop to 113 and below is underway.    

April Crude: The market dropped as low as 59.70 yesterday but this morning has made it as high as 62.60. I still think it will reach 63.50 before beginning a drop to 57.20. Crude is headed for 52.00 and eventually lower than that.

April Gold: I think a drop of $100 is underway. Resistance today is again at 562. Next support on the way down is at  512.  

March Silver: I think a drop of $2.00 is underway. Resistance today is again at 972. Next short term support is at 860.

Google: GOOG has recovered strongly above the 350 level.  Short term resistance above the market is at 385 while support is at 364. Once GOOG leaps over resistance at 405 it will be headed for the next upside target at 495.

Thursday, February 23, 2006

Crude Oil


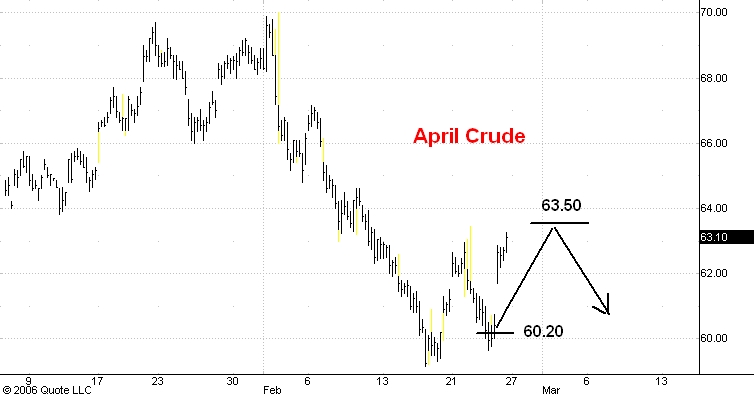
Here is an hourly chart showing pit trading in April crude oil futures.

The market has dipped a little below what I think is support at 60.20. My best estimate is that it will next rally to 63.50. After that a drop to 57.20 will become likely.

S&P Update


Here is an hourly chart showing pit trading in the March S&P futures.

After the first 90 minutes of trading today the market had dropped to 1286.70 and then rallied to 1292.00. At that point I said that I expected another break down to 1285 and that the market shouldn't spend much time above 1292.50 in the meantime.

As you can see from the chart we have spent a fair amount of time above the 1292.50 level so I must conclude that the next stop is 1304.

S&P


Here is an hourly chart showing pit trading in the March S&P futures.

I am very bullish on this market but the price action early this morning makes me think that the market will drop to 1285 today before it can rally to 1304. If I am right then the market should not spend much time above the 1292.50 level.

T-bonds


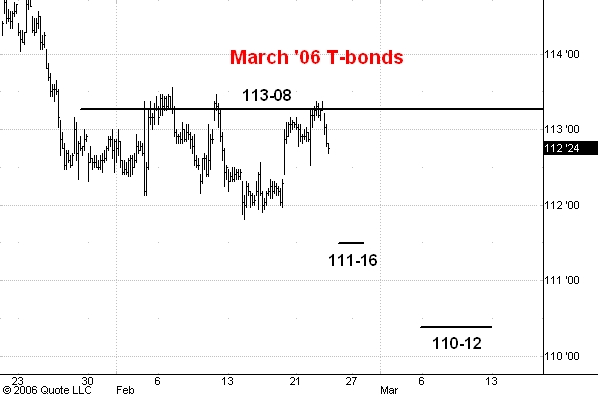
Here is an hourly chart showing pit trading in the March T-bond futures.

The market has done nothing for the past month but I think this is about to change. My reading of trading sentiment is that there is too much bullishness around to justify the expectation of a solid advance from current levels. So I am looking for a drop to 110-12 which will be briefly interrupted by a rally from the 111-16 level.

Eurodollars


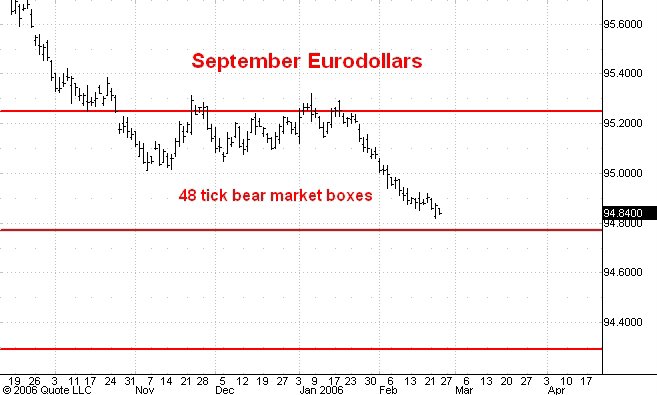
Here is a daily chart of the September eurodollar futures (interest rate, not currency!)

I've drawn the 48 tick bear market boxes that have controlled the downtrend from the 99.09 top of June 2003. I think the market will reach the 94.30 level sometime this year and then begin a mutli-year rally.

Guesstimates on February 23 , 8:50 am ET

March S&P Futures:  Support is at 1285 while the next minor resistance is 1304. The market should reach the 1350 level by late April.  

March Bonds: The next downside target is at 111-16 while resistance today is again at 113-08. I think the market is on its way into the 107-108 zone.

March 10 Year Notes: Resistance is at 108-04 while the next support level beneath the market is at 107-10. I think notes will reach 104 or so in a few months.

Cash Eurocurrency: The next downside target is117.90 while resistance is at 119.80. A drop to 113 and below is underway.    

April Crude: The market should hold 60.20 and then rally to 63.50.  After that the next downside target will be 57.20. Crude is headed for 52.00 and eventually lower than that.

April Gold: I think a drop of $100 is underway. Resistance today is again at 562. Next support on the way down is at  512.  

March Silver: I think a drop of $2.00 is underway. Resistance today is again at 972. Next short term support is at 860.

Google: GOOG has recovered strongly above the 350 level.  Short term resistance above the market is at 385 while support is at 364. Once GOOG leaps over resistance at 405 it will be headed for the next upside target at 495.

Wednesday, February 22, 2006

Gold and Silver


Here are hourly charts showing pit trading in March silver and April gold.

I think both markets are headed much lower.

Yesterday I thought the rallies from last week's lows had ended but today's strength suggests slightly higher resistance levels: 562 in gold and 972 in silver. The next downside targets are 512 for gold and 860 for silver.

Chicago Merchantile Exchange


Here is a daily chart of CME.

This stock has been a bull market leader ever since its IPO and shows no sign of faltering.

CME has exceeded my long standing target at 411 and should rally further to 441. This latter target may well prove to be too conservative.

Board of Trade


Here is a daily chart of the Chicago Board of Trade.

I last commented on BOT here. BOT has rallied since early January and I am impressed by the stock's ability to move upward while the rest of the market reacted that month and early this.

I think BOT will make a new high around 142 before the bull market in the general averages ends.