Here is a 15 minute bar chart of Google. I last discussed this chart here.
I think the 337 low is going to hold and that GOOG is going to reach the 495 level in a couple of months. Meantime you can see that the market has been drifting downward from the 387 top it made just after the break to 338.
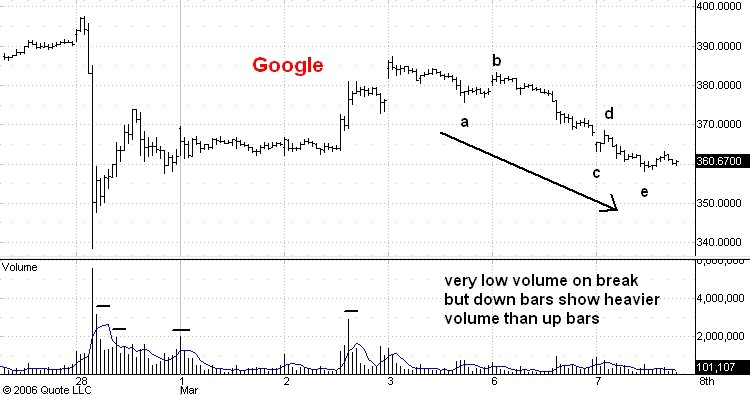
This drop from 387 has shown consistently low volume, especially when compared with the rally from 338 to 387. This is a bullish indication. But note that so far the heaviest volume on the break has been on the down bars. Thus the volume indications have not yet told us that another upswing has started.
There is some bullish evidence to be seen on the chart. Note how the downswing from point d to point e was shorter in time and extent that was the preceeding downswing. This is the first piece of evidence that the drop from 387 may be ending. I'd like to see a rally bigger than the rally from a to b together with some obvious sign of increasing volume before I conclude that the drop from 387 is complete.
No comments:
Post a Comment