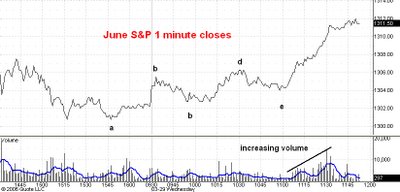
Here is a line chart showing prices at one minute intervals during regular hours trading in the June S&P e-mini futures.
I have labeled the swings since yesterday's low at 1300.25. The important thing to notice is that the current swing upward from point e is the longest of the upswings in both price and time. Moreover, volume has steadily increased on this upswing. As I observed in my previous post the entire move up from point a has already exceeded the length of the biggest rally in the correction from 1321.50 to 1300.25.
All these facts are signs of a strong market and are telling me that the move up from point a has a lot further to go.
1 comment:
Carl, good calls on the S&P, but make up your mind: gold and silver are NOT going down alone.
If they go down, the S&P will follow.
We're not going to 1350 S&P with a declining gold and silver.
It's all a matter of massive liquidity.
Silver 11.34 this morning means only one thing: the stock market has a huge liquidity support.
Thanks a lot Fed!!
Post a Comment