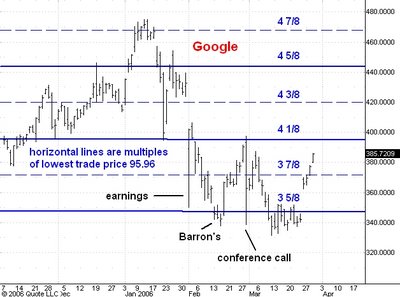
Here is a daily chart of Google.
The market has absorbed a lot of bad news over the past couple of months. On February 1 earnings news drove GOOG to a low of 350. On February 13 Barron's ran a very negative cover story on Google which drove the price down to 337. On February 28 Google's CFO made some stray remarks during a conference call with analysts to the effect that no tree grows to the sky and GOOG lost 60 points in an hour.
By the time GOOG reached the 331.55 low on March 10 it was evident from my e-mail and comments on this blog that there was a great deal of bearishness on GOOG. But what impressed me at the time is that depsite all the upset, GOOG was trading less than 20 points below the level it had reached after the February 1 earnings announcement. This was a sign that there was strong buying on bad news by people who were not likely to sell on small rallies. This in turn implied that the market would head substantially higher, to 495 I thought.
On March 24 GOOG gapped higher on the news that it would be added to the S&P 500. I regarded this as a warning that the 495 level would not be reached this cycle. But I thought then and still think now that GOOG will rally at least to the 440 level, which is the 4 5/8 multiple of its 95.96 trading low in 2004 after its IPO.
Shorter term I expect GOOG to reach resistance in the 397-400 zone at the 4 1/8 multiple of the 95.96 low before another reaction becomes likely.
No comments:
Post a Comment