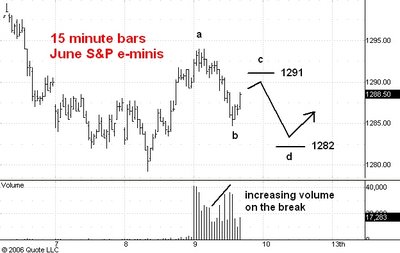
Here is a 15 minute bar chart showing regular hours trading in the June S&P e-minis. The June contract became the front month today which is why you see no volume bars prior to today's.
I think that yesterday's low at 1279.25 was the low of the break which started from 1309.25 on March 3 in the June contract. I explained some of my reasons yesterday.
From today's early high at 1294 the S&P's dropped on increasing volume to 1284.75 and then rallied on lower volume. If the drop from 1294 is a reaction within an uptrend as I think it is, it should be a three phase affair with two down phases separated by an intervening rally. The fact that volume increased on the way down to 1284.75 makes believe that the drop from a to b was the first phase of the correction. I am guessing that the second phase, a rally from b to c will be about 6 points and will end near the 1291 level. The third phase should then carry the market down to a point d near 1282.
Once this correction is complete I am expecting a move up to 1325.
1 comment:
In the first sentence of the post I said clearly that I was discussing the June S&P futures contract, not the cash and not the March contract
Post a Comment