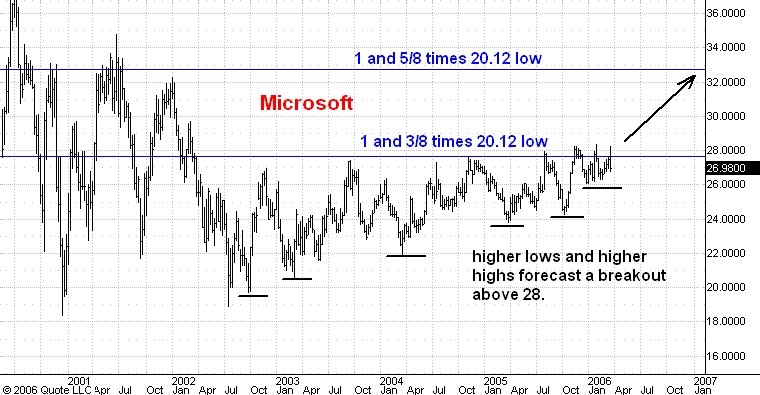
Here is a weekly chart of Microsoft since its 2001 low at 20.12. This chart shows MFST adjusted for divident payouts so it shows an adjusted low near 18.00 instead of the actual print low of 20.12. In doing my analysis I prefer to use the print low rather than the divident adjusted low.
The thing that jumps out at me from this chart is that MSFT has been going sideways for 3 and 1/2 years now. During this time it has made a succession of higher lows on the weekly chart. I think this action forecasts a breakout above the 28 level. The first upside target would be roughly 33, at 1 and 5/8 times the 20.12 low.
No comments:
Post a Comment