
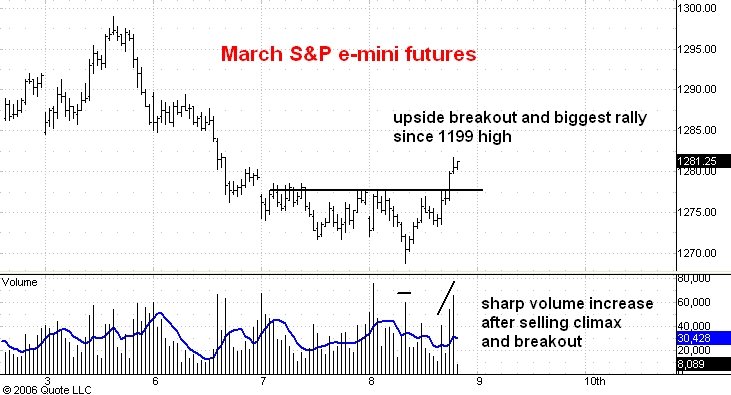
Here is a 15 minute bar chart showing regular hours trading in the March S&P e-mini futures.
This morning I pointed out that the market was continuing to show higher volume on rallies. After that post the S&P proceeded to break below the low of its trading range and showed a very definite volume climax as it did so. The fact that the market immediately recovered above the 1272 level shows that the volume came largely from weak buyers getting stopped out and breakout following sellers. The buying on such a downside breakout generally comes from people who can't be scared out of a long postion by a little adverse price action and this sort of buying strengthens the market's technical position.
On the subsequent rally you can see a very pronounced trend towards high volume on up bars. Morover, the market has broken above the highs of the last two day's trading range and in doing so has put in the biggest and longest rally since the start of the drop from 1299.
All of these indications are bullish and are pointing to much higher prices ahead.
No comments:
Post a Comment