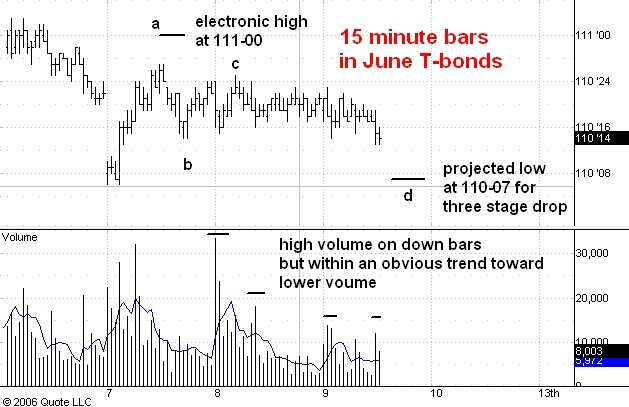
Here is a 15 minute bar chart showing regular hours trading in the June T-bond futures.
I think the drop that started from the 111-00 high in electronic trading will carry the market down to 110-07 or so and then be followed by a move to 111-16. Here's why.
In my view the drop from 111-00 is corrective and most corrective trends assume a clear three phase form; in this case two downward phases of about equal length separated by a rally phase. The first downward phase ended at 110-14 at point b, a drop of 18 ticks. Subtracting 18 ticks from point c at 110-25 gives us 110-07 as downside target.
Note how the volume is showing an obvious tendency to drop as the correction from 111-00 proceeds. This is confirming evidence that there indeed will be another upward phase which will carry the market above 111-00. However, within the drop from 111-00 the high volume bars are all down bars. This is telling us that the drop from 111-00 is not over.
No comments:
Post a Comment