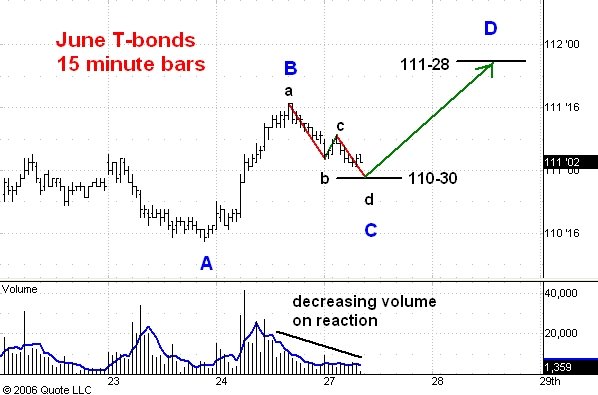
Here is a 15 minute bar chart of June T-bond futures.
I think this market will soon enter the third and final phase of its rally from the 110-13 level at point A in blue. Note how the second phase ( blue B to C) itself is taking on a three phase appearance. The third phase, black c to d, should stop at support near 110-30 and thus be shorter in time and price that the first phase, black a to b. This together with the fact that volume is visibly dropping on the break from blue point B is more evidence that the market is headed for 111-28.
After 111-28 is reached the bonds are likely to drop below 110.
No comments:
Post a Comment