Here is a 15 minute bar chart of trading in June T-bond futures during regular trading hours.
Yesterday I said that a minimum target for the break from the February 28 top at 113-05 was 109-26. This morning in electronic trading the market hit 109-31 and has since rallied.
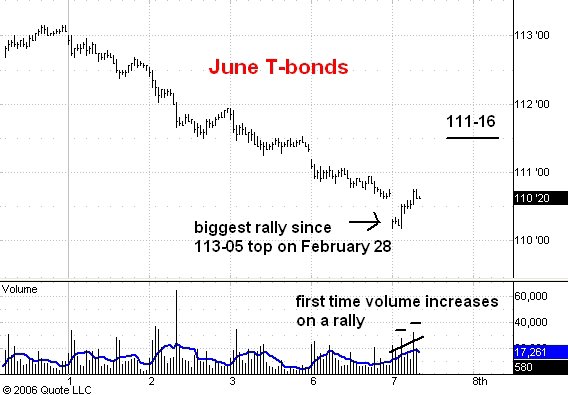
Notice that the rally so far has been bigger than any rally since the February 28 top. More importantly, volume has shown a pronounced tendency to be high on up bars, a reversal of its pattern during the previous break. These two fact make me believe that a typical three stage rally has begun from the 109-31 low. The rally will have two upward phases separated by a reaction that will probably carry the market down close to 109-31 again. The last upward phase will probably end near 111-16. After that I expect the market to resume its downtrend toward 108 and lower.
No comments:
Post a Comment