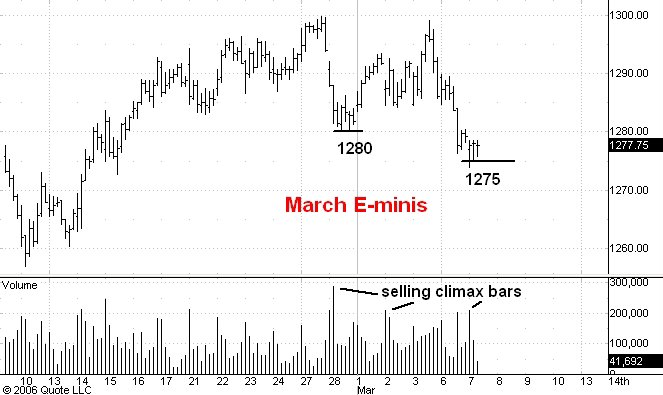
Here is an hourly chart of regular hours trading in the March S&P e-mini futures.
I have highlighted three volume climax situations on the chart, today's opening hour being the last of the three. The key thing to look for is unusually high volume developing at a support level with little or no downside price follow through.
Since I estimate support at 1275 I believe that today's opening hour volume and the two subsequent sideways hours is telling us that the market is about to rally significantly. I think we will see 1320 by the end of the month.
No comments:
Post a Comment