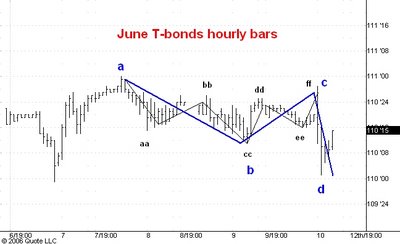
Here is an hourly chart showing pit and electronic trading in the June T-bond futures. I last discussed this market here and here.
The chart illustrates nicely the tendency of markets to move in three phase rallies and declines while in a corrective situation. Right now I think the three phase correction, the blue a-b-c-d pattern, is over and that the market is headed up to 111-16. Looking within the blue a-b-c-d pattern notice how the move from a to b was a three phase break and how the move from b to c was a three phase rally.
The drop from 111-00 (blue point a to blue point d) was itself the middle, downward phase of what I have been projecting to be a three phase rally from 109-31. I think the move up from today's low to 111-16 is the third and final phase of that rally.
No comments:
Post a Comment